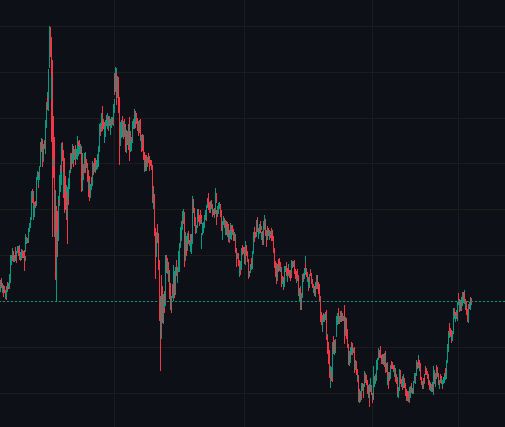
Вопрос звучит просто: где искать мелких участников, а где крупных - на минутке или на дневке? Ответ не такой прямой, как хочется, но логика распределения активности по таймфреймам вполне читаемая.
The question sounds simple: where do you look for small players and where for the big ones - on the one-minute chart or the daily? The answer isn't as straightforward as we'd like, but the logic behind how activity is distributed across timeframes is quite readable.
Why retail lives on the lower timeframes
With a small account, you can't hide a distant stop-loss: the risk per trade hits the limit of your deposit size long before it hits a sensible technical point. And with far-off take-profits at that kind of stop, you can't really trade at all - the ratio just doesn't work out.
That naturally pushes a big chunk of retail traders into scalping and intraday trading. There, you can make money fast and, as most hope, lose little.
There are a huge number of small and relatively small participants. That's exactly why I look for their short-term activity first on M1, M5, and M15 - that's where it's most densely packed.
Why do traders with small accounts choose scalping?
With a small deposit there's nothing to put a distant stop with, while a short distance lets you trade at a risk level the account can handle.
Does that mean only small players trade on M1?
No, big players work on minute charts too, their share of overall trades there is just noticeably smaller.
What counts as crowd activity?
A mass of small, similar decisions that create local impulses and quick pullbacks without follow-through.
A big player needs time
You can't build a large position with a single order without moving the price. It has to be spread out over time, worked in pieces, sometimes over weeks.
That's exactly what creates structures that read better on higher timeframes: long ranges, repeated returns to the same zone, ranges the price eventually breaks out of with a different character of movement. On D1 it looks like a single formation; on M1 it looks like chaos across hundreds of candles.
That's why I look at mid-term and large-scale market structure on the daily and above, rather than trying to piece it together from minute charts.
Timeframe doesn't measure participant size
An important clarification, without which the whole idea turns into a myth: the chart doesn't label who made a given trade. Big players are present on M1 too, and small ones happily hold positions on D1.
The difference lies elsewhere - in what shows up in the frame more often. Lower timeframes are dominated by short-term noise, local moves, and the activity of a large number of small accounts. Higher timeframes show the consequences of a position being built or unwound over time.
| Timeframe | What you see more often | Downside |
|---|---|---|
| M1-M15 | Short-term noise, crowd activity | Structure breaks down into detail |
| H1-H4 | Transition from noise to structure | Mixed picture |
| D1 and above | Traces of accumulation and distribution | Few entry points, late signals |
My takeaway is simple: don't look for the participant themselves, look for the traces of their actions in price structure. Account size doesn't show up on the chart, but the character of the move, the duration of a zone, and how price behaves on a return - those do.
Frequently Asked Questions
Which timeframe is best for spotting accumulation zones?
D1 and above, because building a large position takes time and that creates a noticeable structure there specifically.
Can you spot a big player from a single candle?
No, a single candle says nothing about participant size - only a structure made of several moves can be read.
Why bother looking at a higher timeframe if you trade within the day?
To understand what structure the price is sitting in and avoid mistaking local noise for an independent move.
What's the difference between noise and structure?
Noise is fast movement without follow-through or repetition; structure repeats and holds its boundaries.
What does a chart's timeframe actually show?