50 pieces
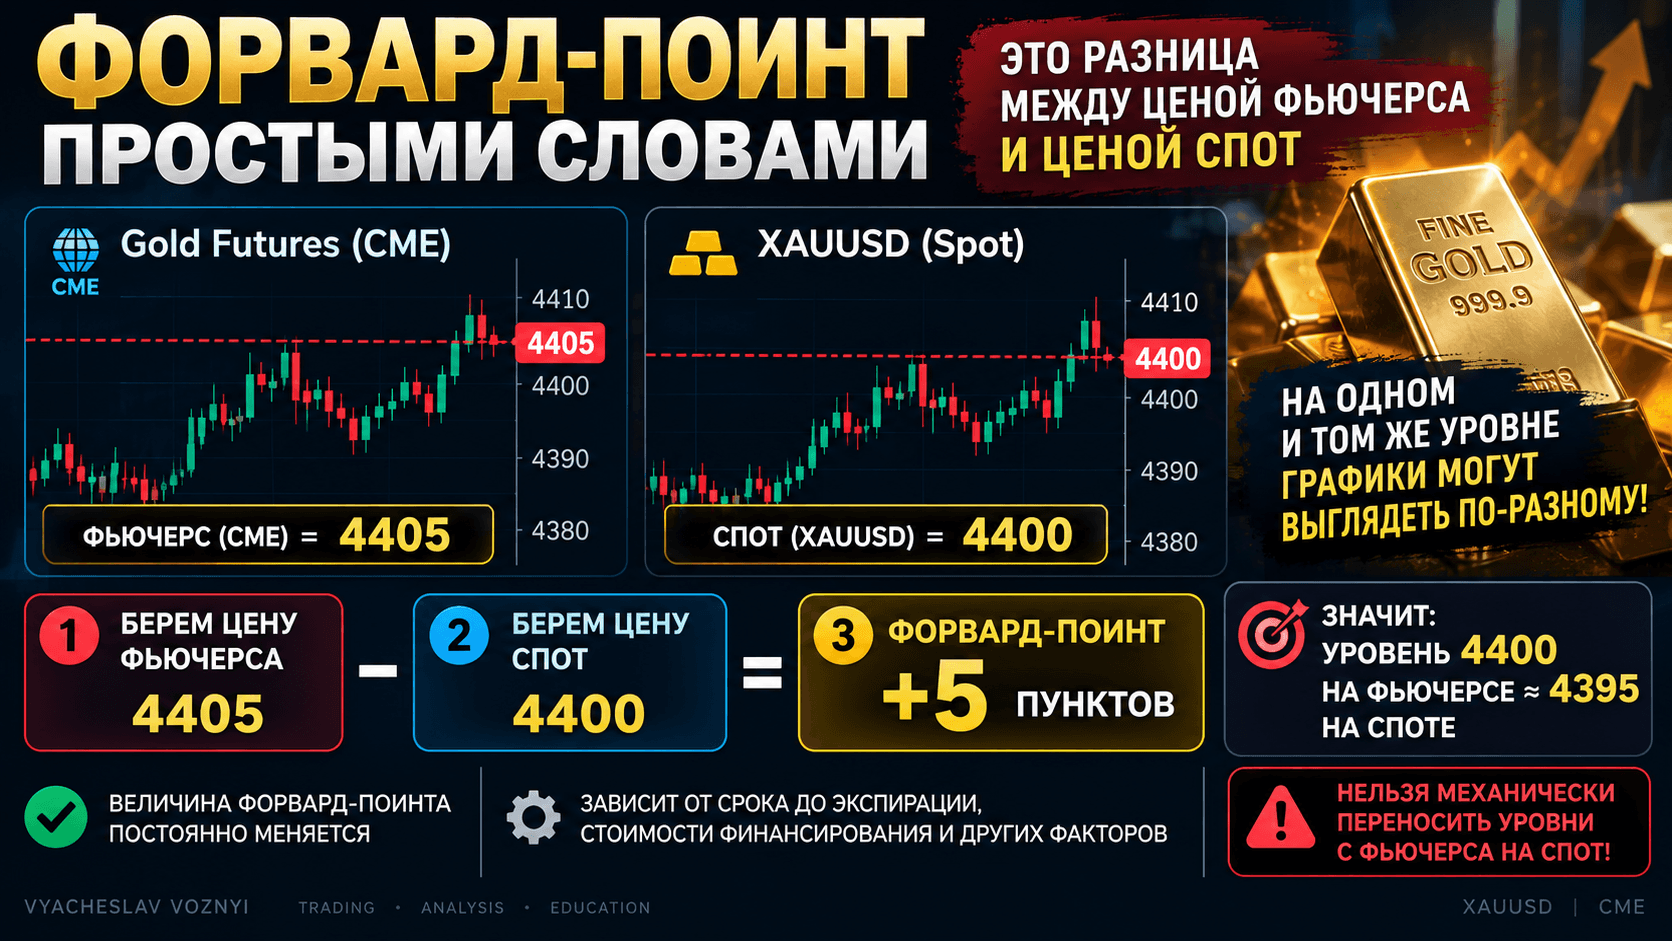 Latest breakdownHow to Transfer Levels from Gold Futures to SpotIf you're watching levels on the Gold Futures chart but trading XAUUSD, the numbers won't match. Not because there's an error in the data somewhere, but because these are two different instruments with different settlement dates. The gap between them is called the forward point, and you need to be able to calculate it quickly.80
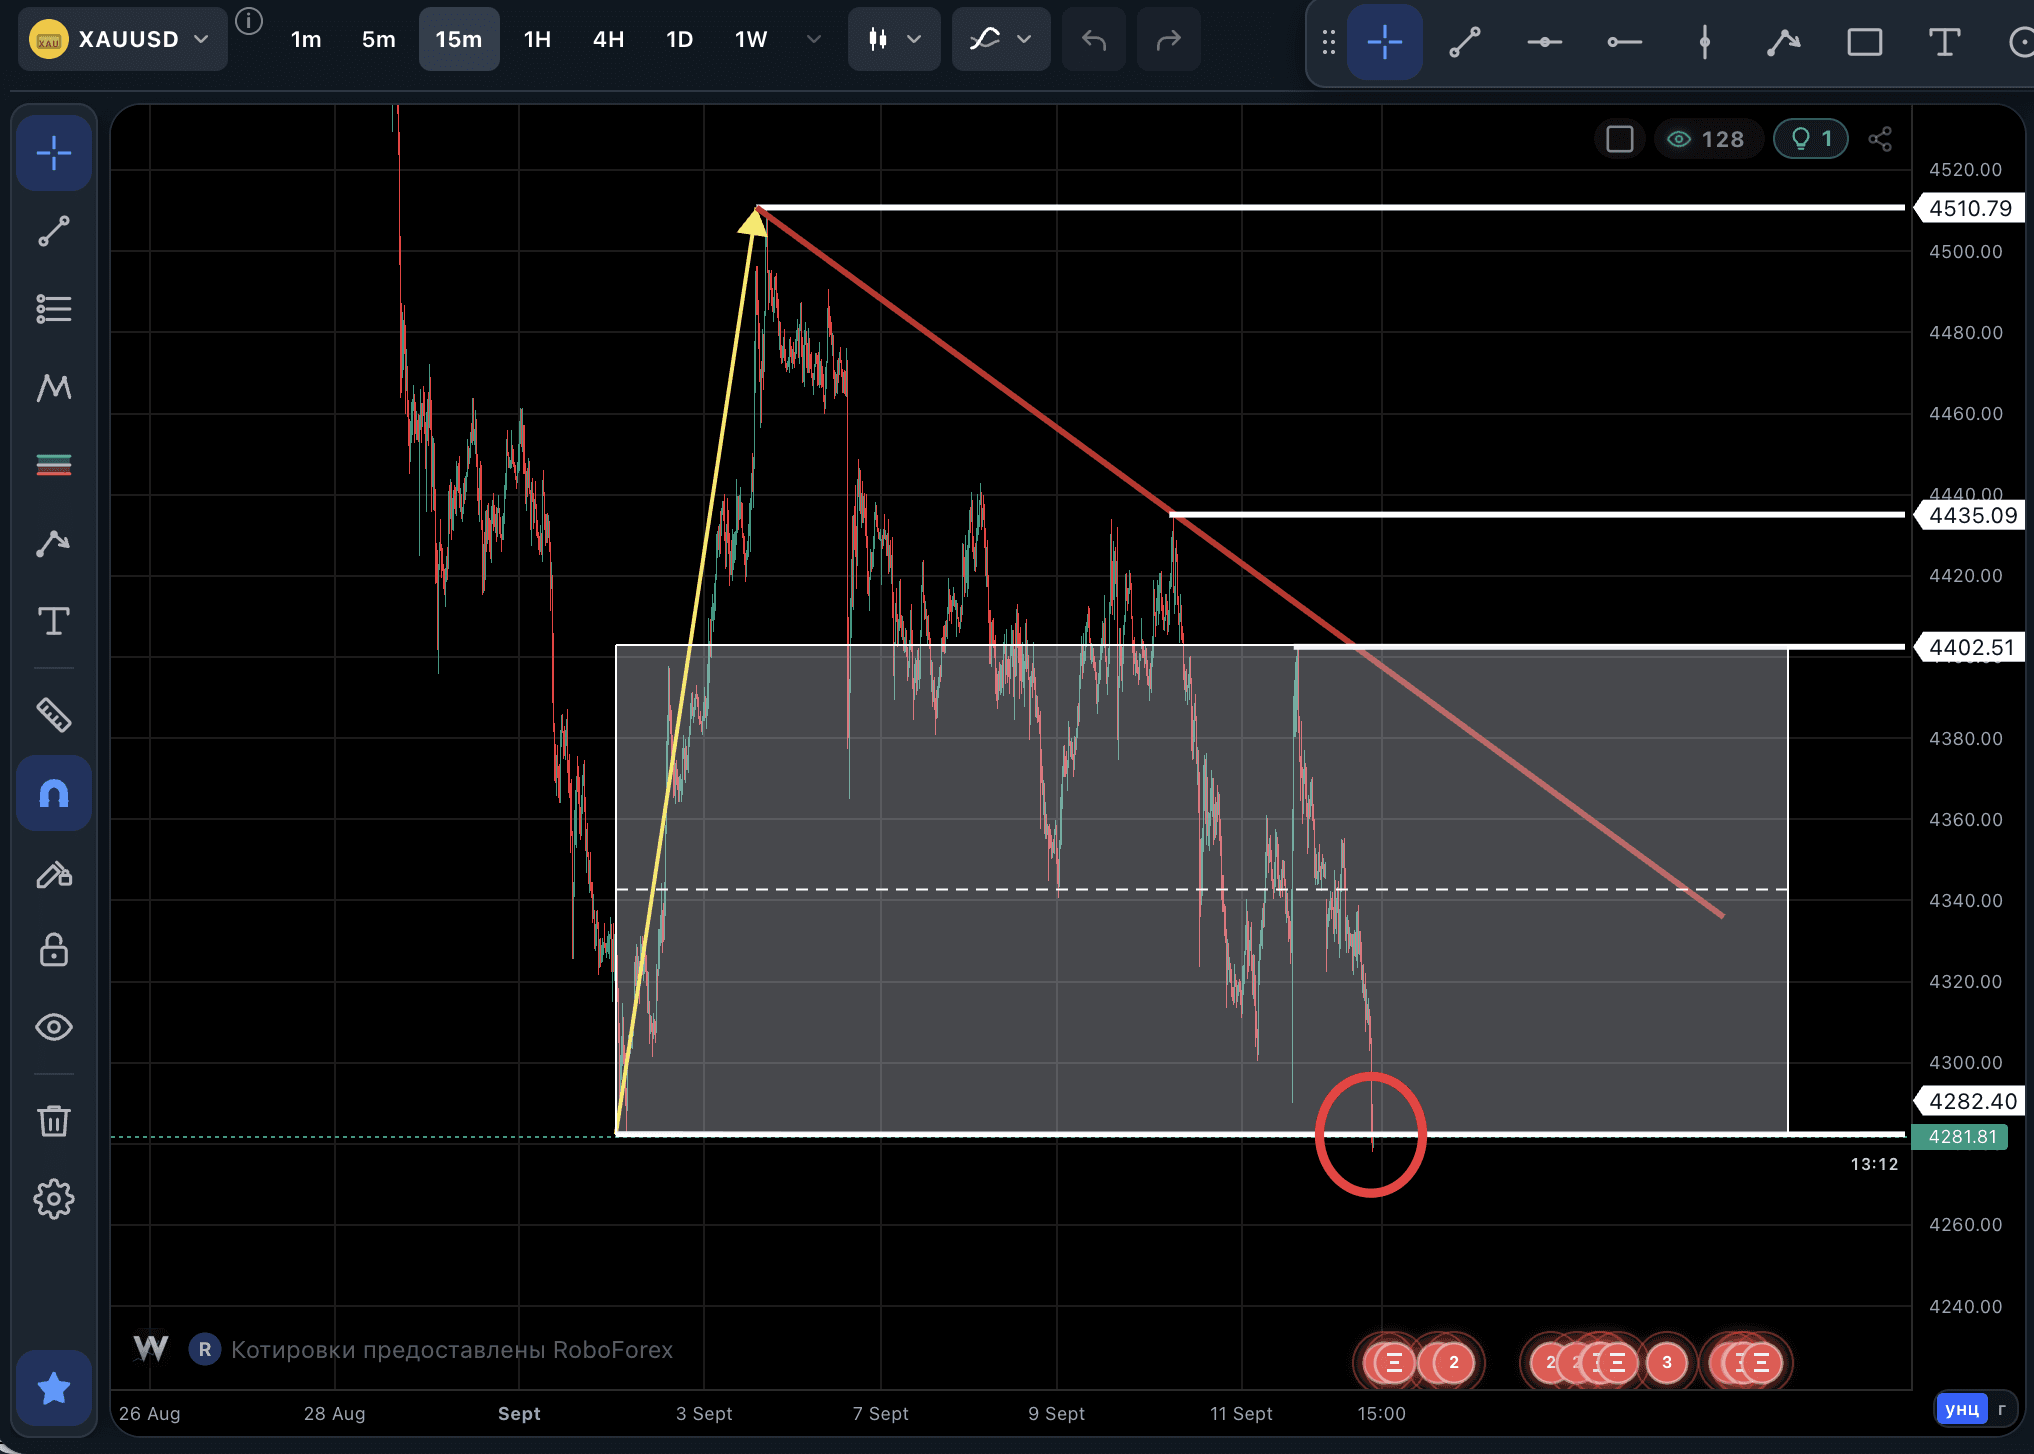 Gold XAUUSD: Break of 4282 or False Breakout?Gold has approached the lower boundary of accumulation at 4282 and closed right on it - 4282.07. This isn't an approach from a distance, this is already a touch, and sellers are now testing whether they have enough strength to push through the level.217
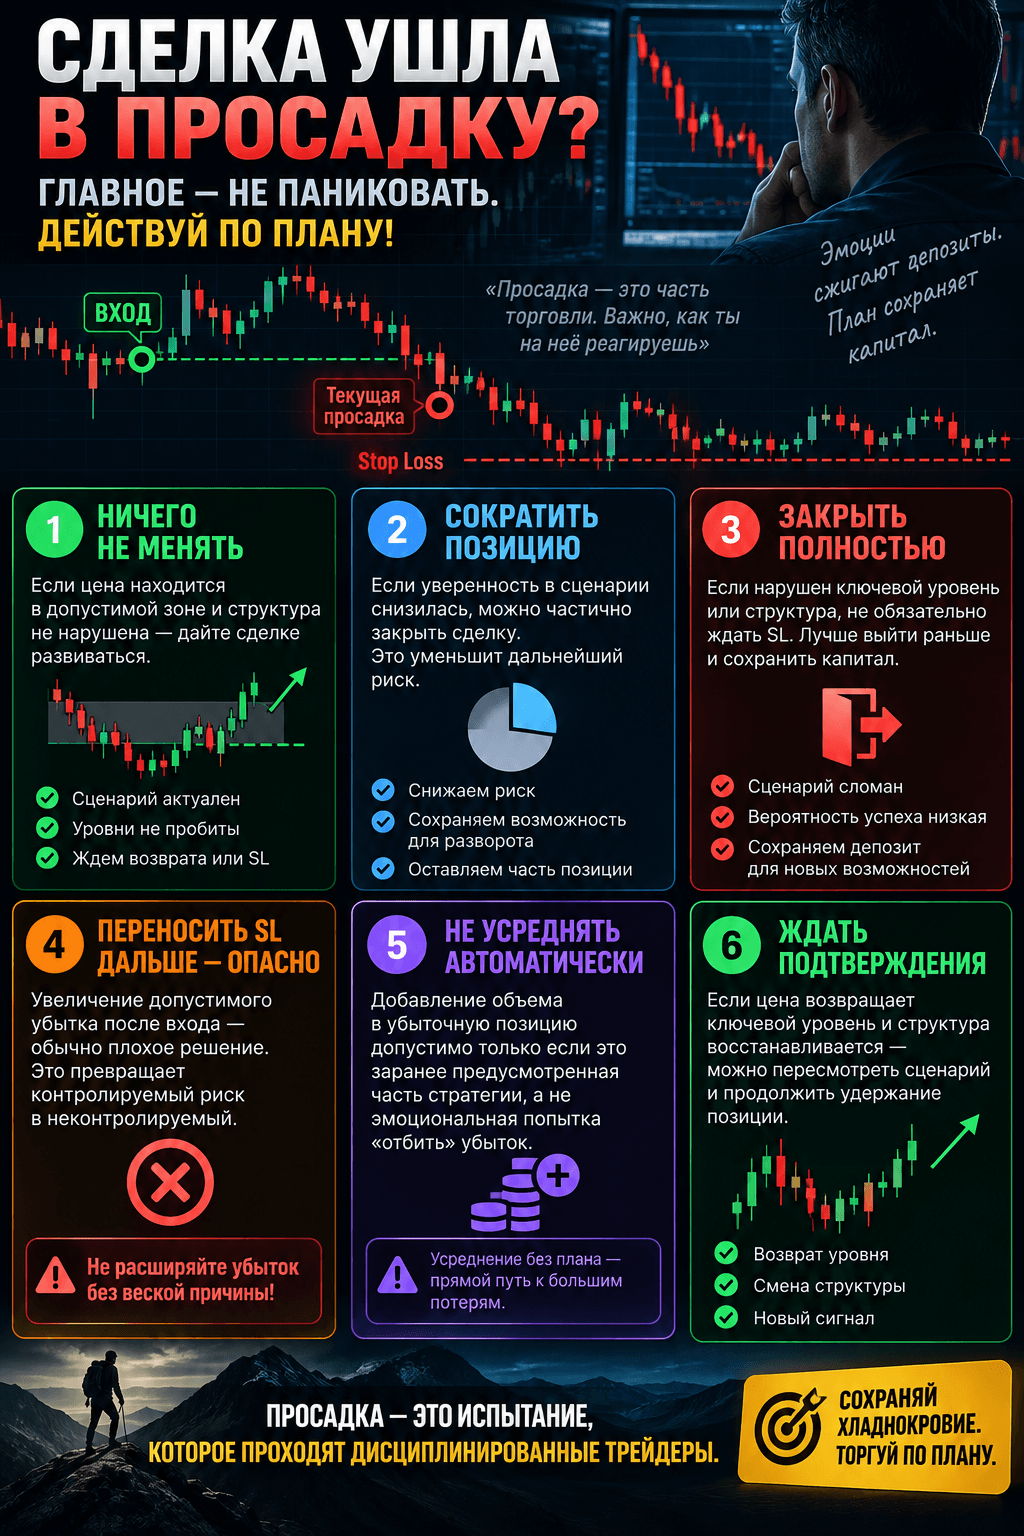 Drawdown on a Trade: Reduce or CloseThe most expensive mistake with a losing position is the urge to immediately do something about it. As long as price stays within the acceptable zone, being in the red isn't new information - it's just normal market behavior within the risk you already accepted. For me, the key thing here is separating the fact of a drawdown from the fact of a broken scenario.174
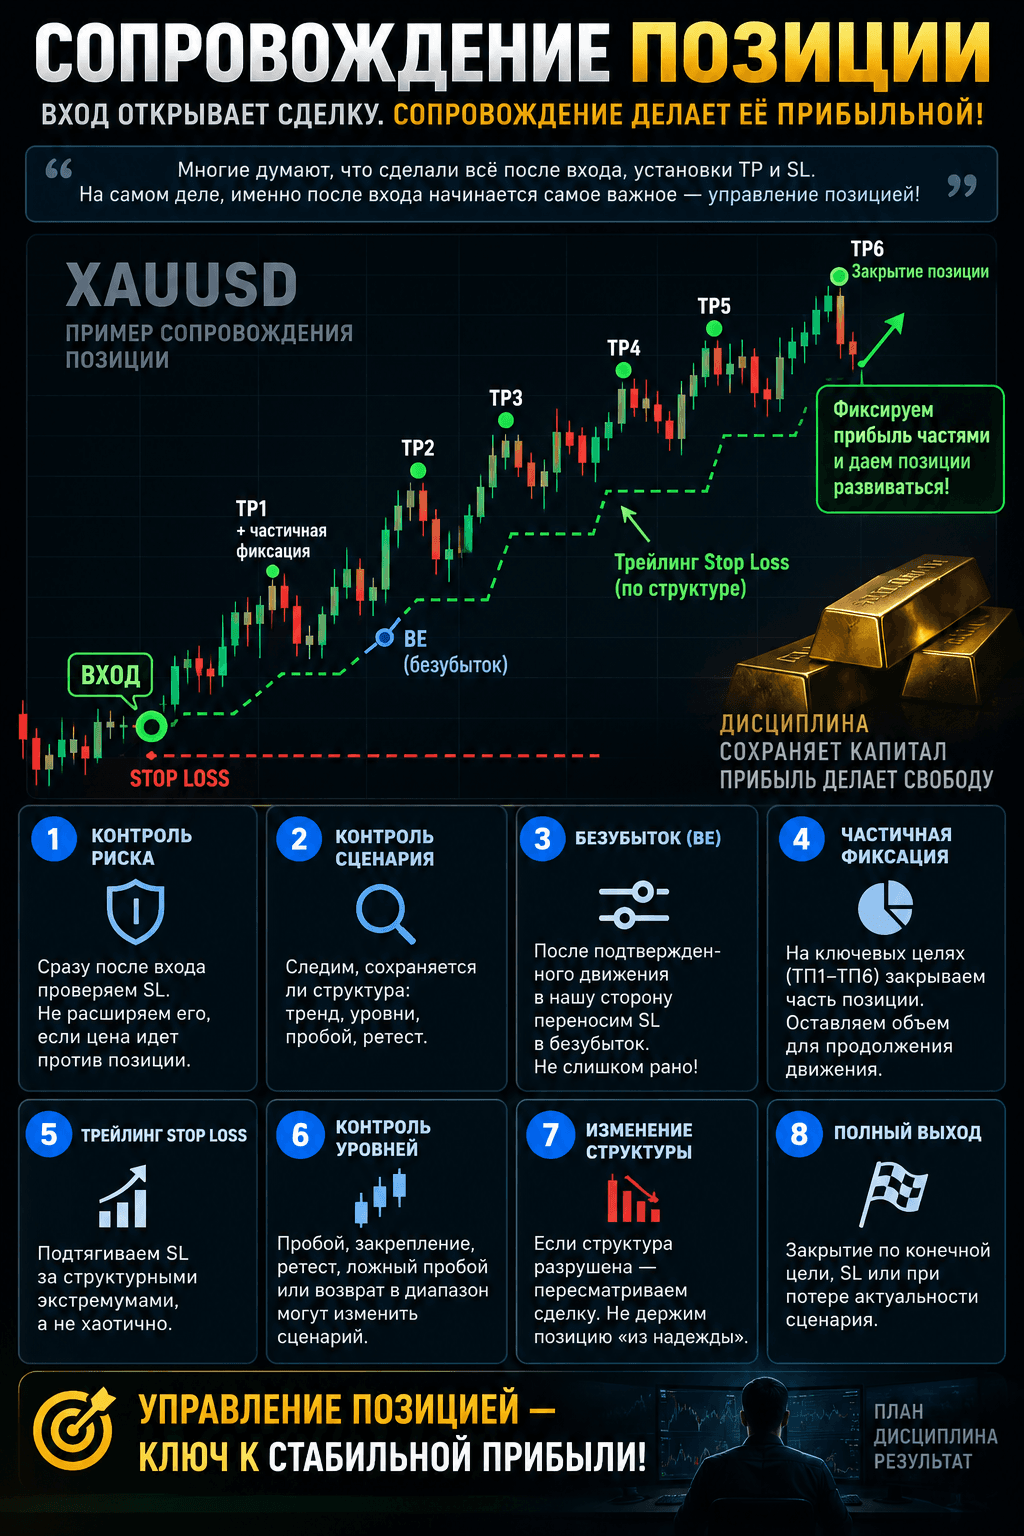 How to Manage an Open Position: 8 StepsMost people think a trade is done once it's placed: entry, Stop Loss, Take Profit, and the market handles the rest. For me, the most important part starts right after entry. Entry opens the trade, but management decides how much risk I keep and how much profit I actually capture.208
 False Breakout of a Level: How to Trade ItIf a large player can use a false breakout of a level for their own purposes - for example, to quickly build a position against the crowd - then trying to guess their moves in advance is a losing game from the start. We're on the other side of the order book and have no information about their plans. So what's needed is a criterion that doesn't depend on guesswork.254
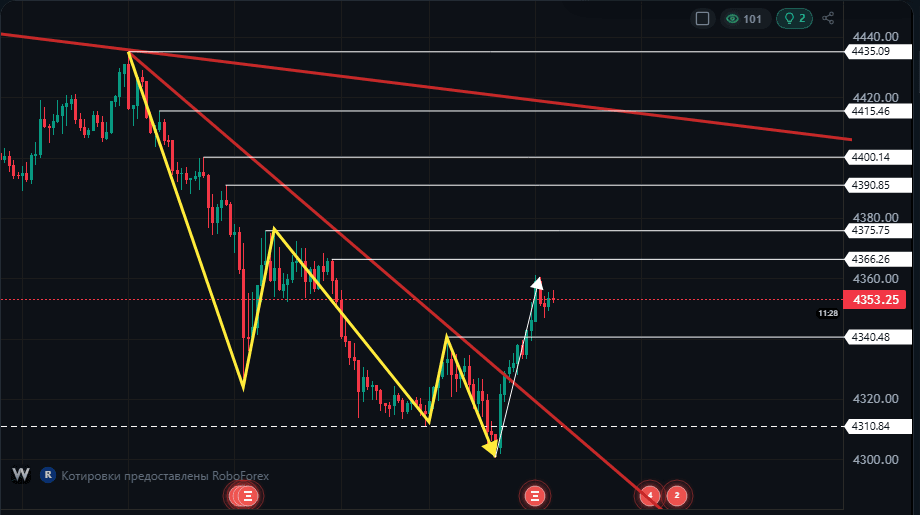 Gold XAUUSD: 4340 Breakout and Where to Look NextGold broke the 4340 level, which matters for the short-term picture, and kept pushing higher after the breakout. The last closed price is 4353.1 - meaning price didn't just poke above the border and snap back, there's genuine follow-through.113
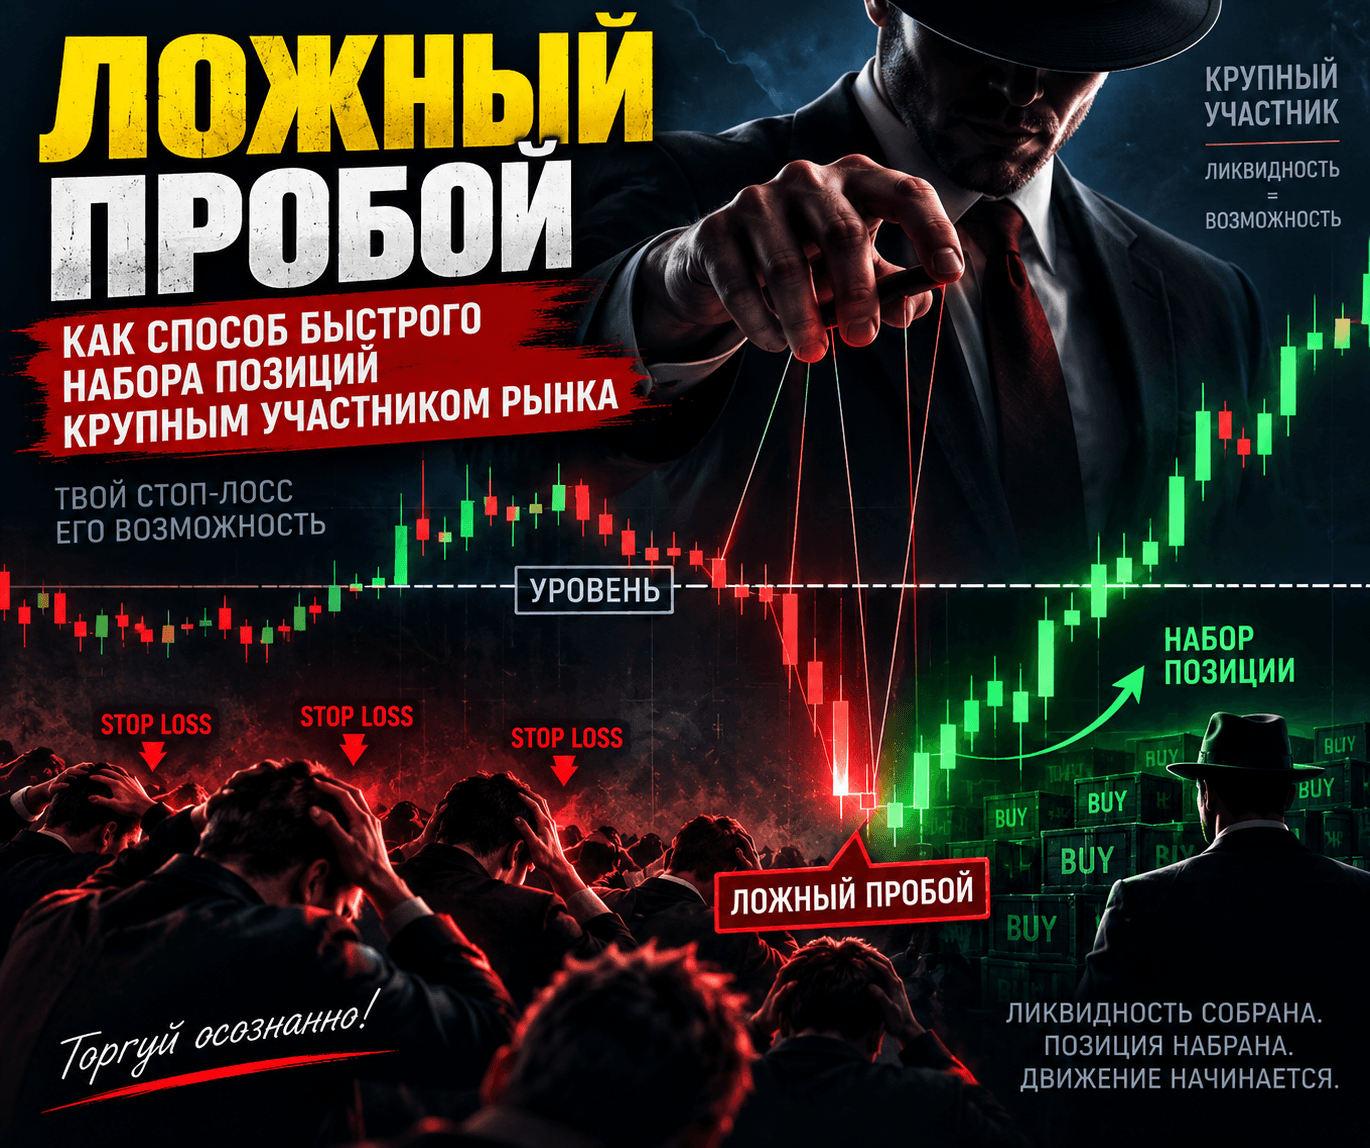 Why Big Players Need a FakeoutI don't read a fakeout as a market mistake, but as a working tool for building a position. Let me break down step by step why it's needed by someone entering with large size, and why liquidity always ends up sitting right behind the level that hasn't been touched yet.164
 How to Avoid Blowing Your Account Trading GoldGold delivers the kind of moves people come to it for. But those same moves have a flip side: an account that grew for a month can get wiped out in one evening. Below are the rules that work for me as a filter before every entry.199
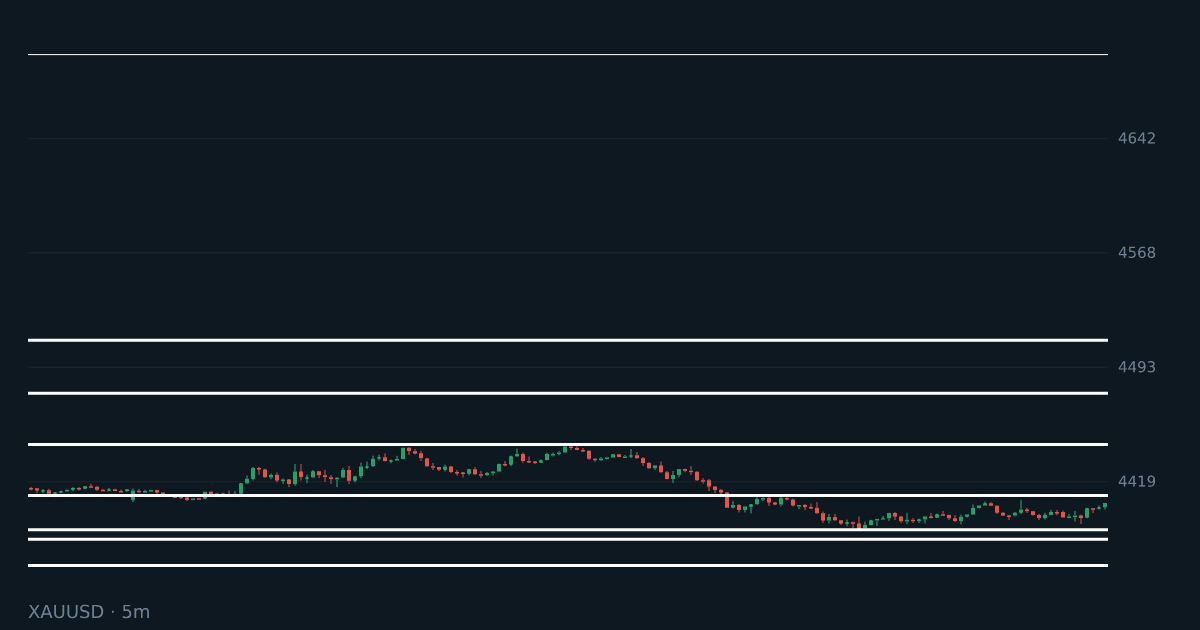 Gold XAUUSD: Accumulation Zone 4387-4409Gold is trading inside the range of Friday's impulse move: I'm marking the boundaries of this move at 4387.31 on the low end and 4442.95 on the high end. The last closing price is 4401.94, so we're roughly in the middle, leaning toward the lower half.186
 Why Your XAUUSD Gold Account Gets Blown OutGold doesn't forgive chaotic trading. The instrument delivers strong moves, but it makes you pay for them with range: what looks like noise on other pairs becomes a full-blown move against your position here. Here are the mistakes I run into most often.201
 Why Beginners Trade Gold XAUUSD and Lose MoneyGold is almost always moving, and that's the first thing a beginner notices: big candles, long impulses, trends that run for days. From that comes a simple, almost universal conclusion: if it moves a lot, it must be easier to profit from. The problem is that an account grows and falls by the same rules in both directions, and a bigger amplitude cuts both ways.234
 Iceberg Orders: How Big Players Build PositionsWhen I say "iceberg," I don't mean a candlestick pattern you can circle on a chart, but the logic behind how big money operates. The name stuck because of the obvious analogy: the tip sticks out above the water, while the bulk of the mass is hidden beneath it.129
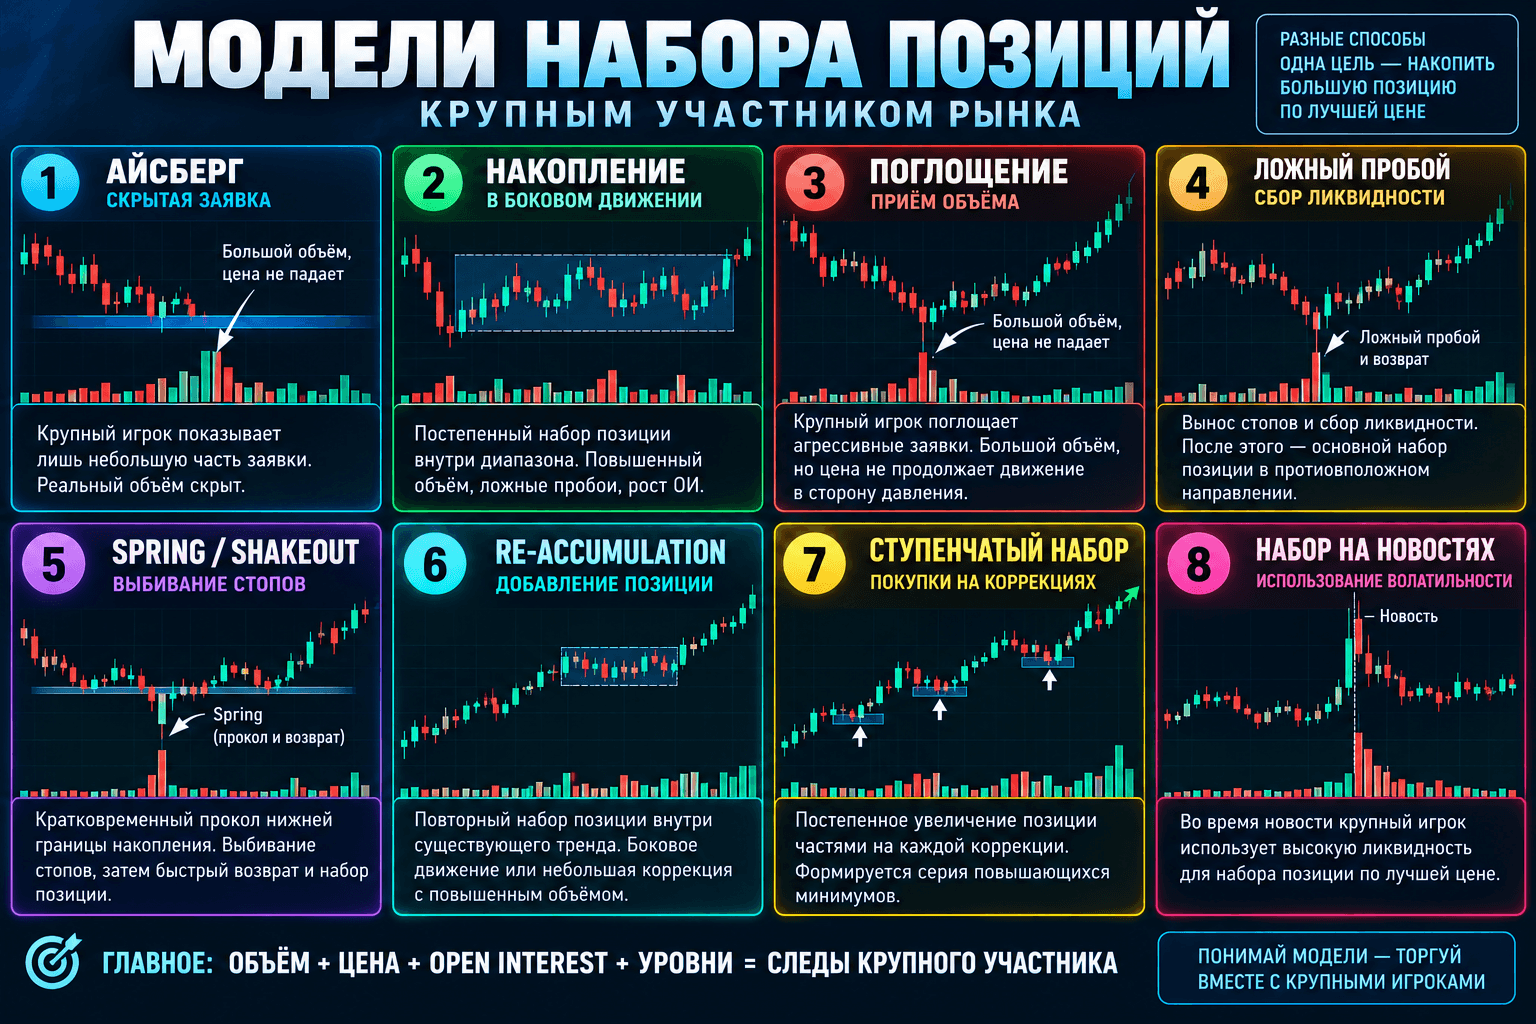 How to Spot Large Players Building a PositionA large position can't be built with a single click - the market simply won't offer that much liquidity at the price you want. So building a position always stretches out over time and gets disguised as ordinary trading. Below I break down the patterns I use to spot it, and the combination of data I look at on CME.213
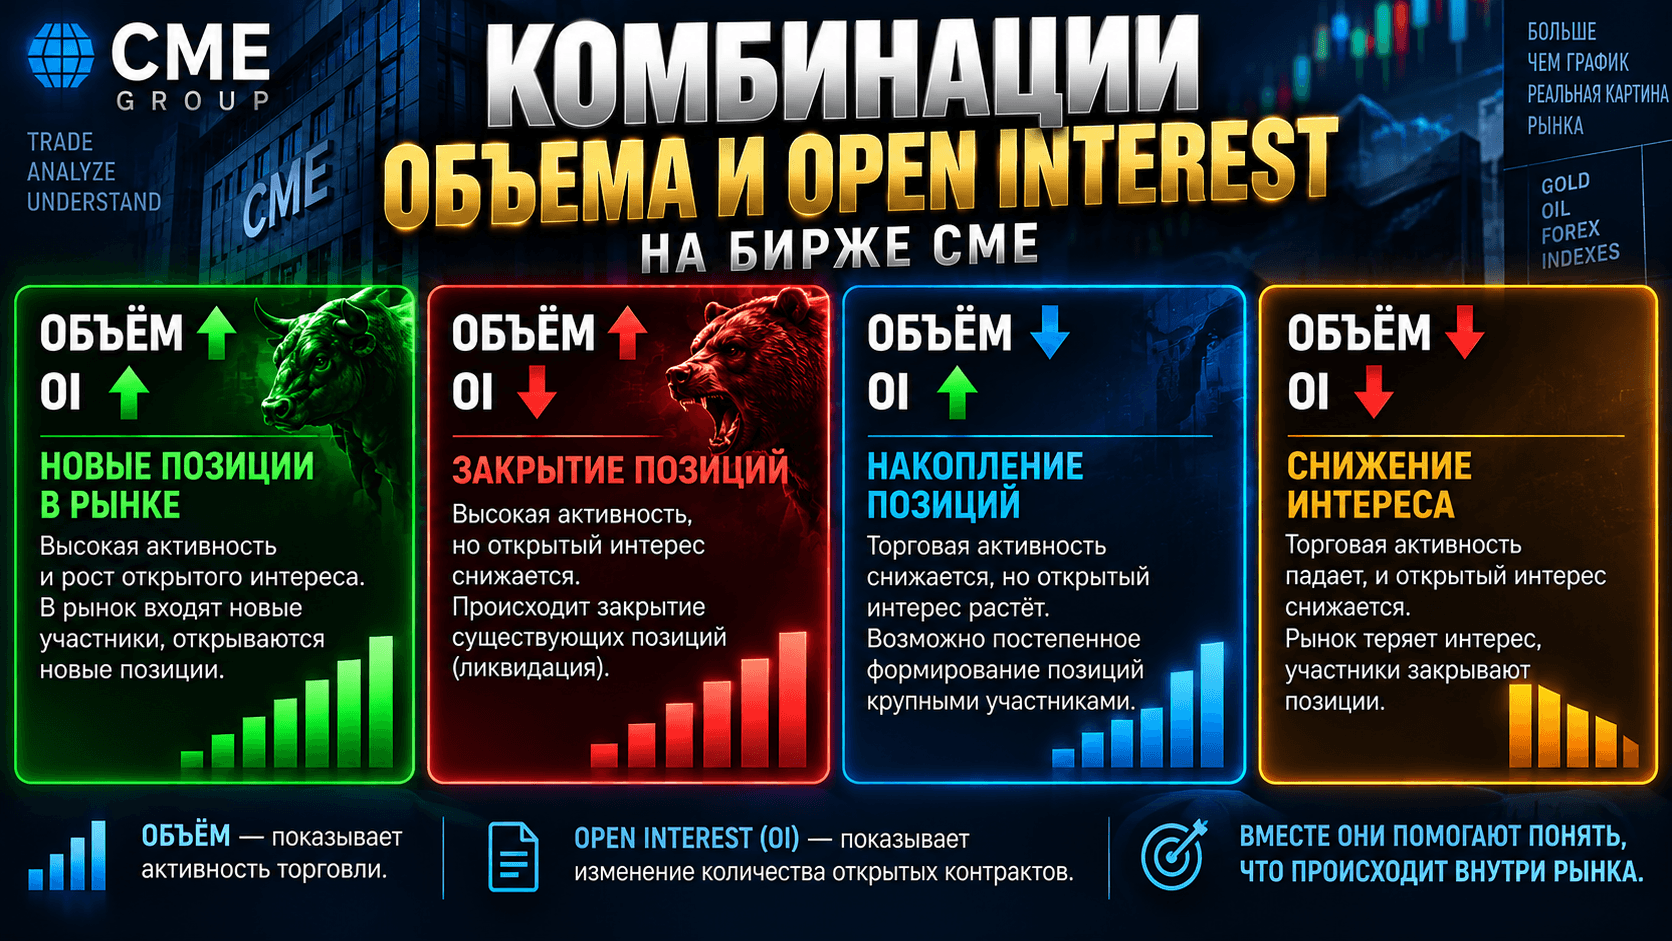 Gold Volume and Open Interest: How to Read ThemOn the gold futures at CME I've got two numbers pointing in different directions. Volume tells me how many contracts changed hands during the session. Open interest tells me how many contracts remained open after it. A trade can open a new position, close an old one, or simply pass one from hand to hand - and that difference is what OI shows and volume doesn't.263
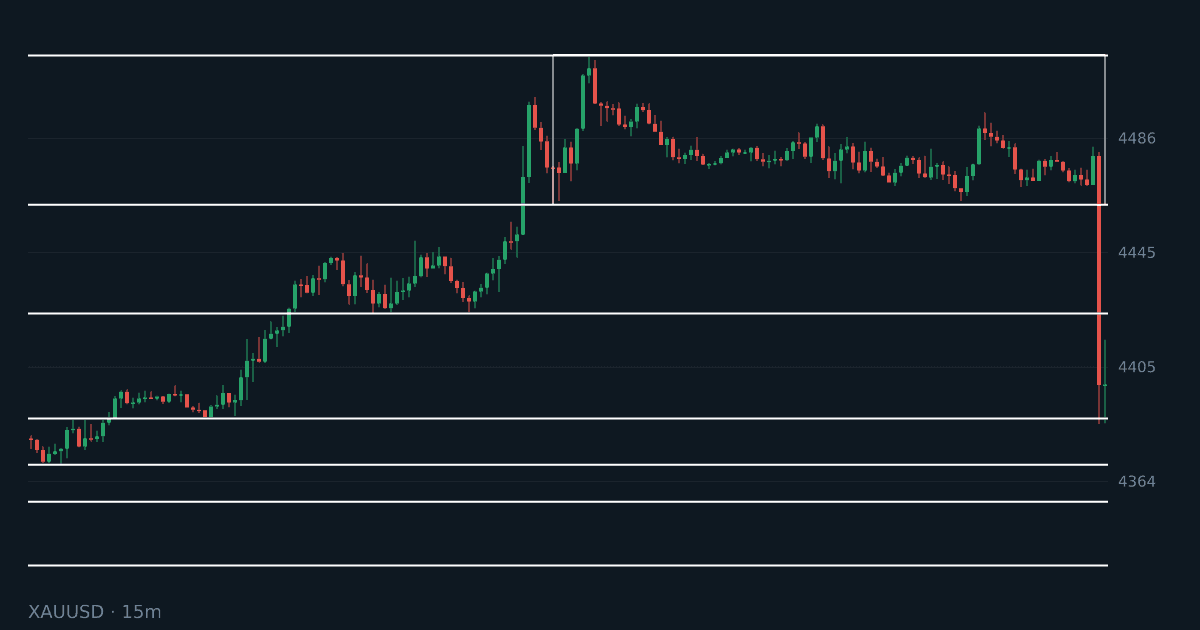 XAUUSD after NFP: Playing Out the BreakoutGold spent several sessions sitting in accumulation, and when the jobs data hit, price broke out beyond its boundary. This is exactly the scenario accumulation setups are watched for: a tight range ahead of the news, followed by a sharp move in one direction.144
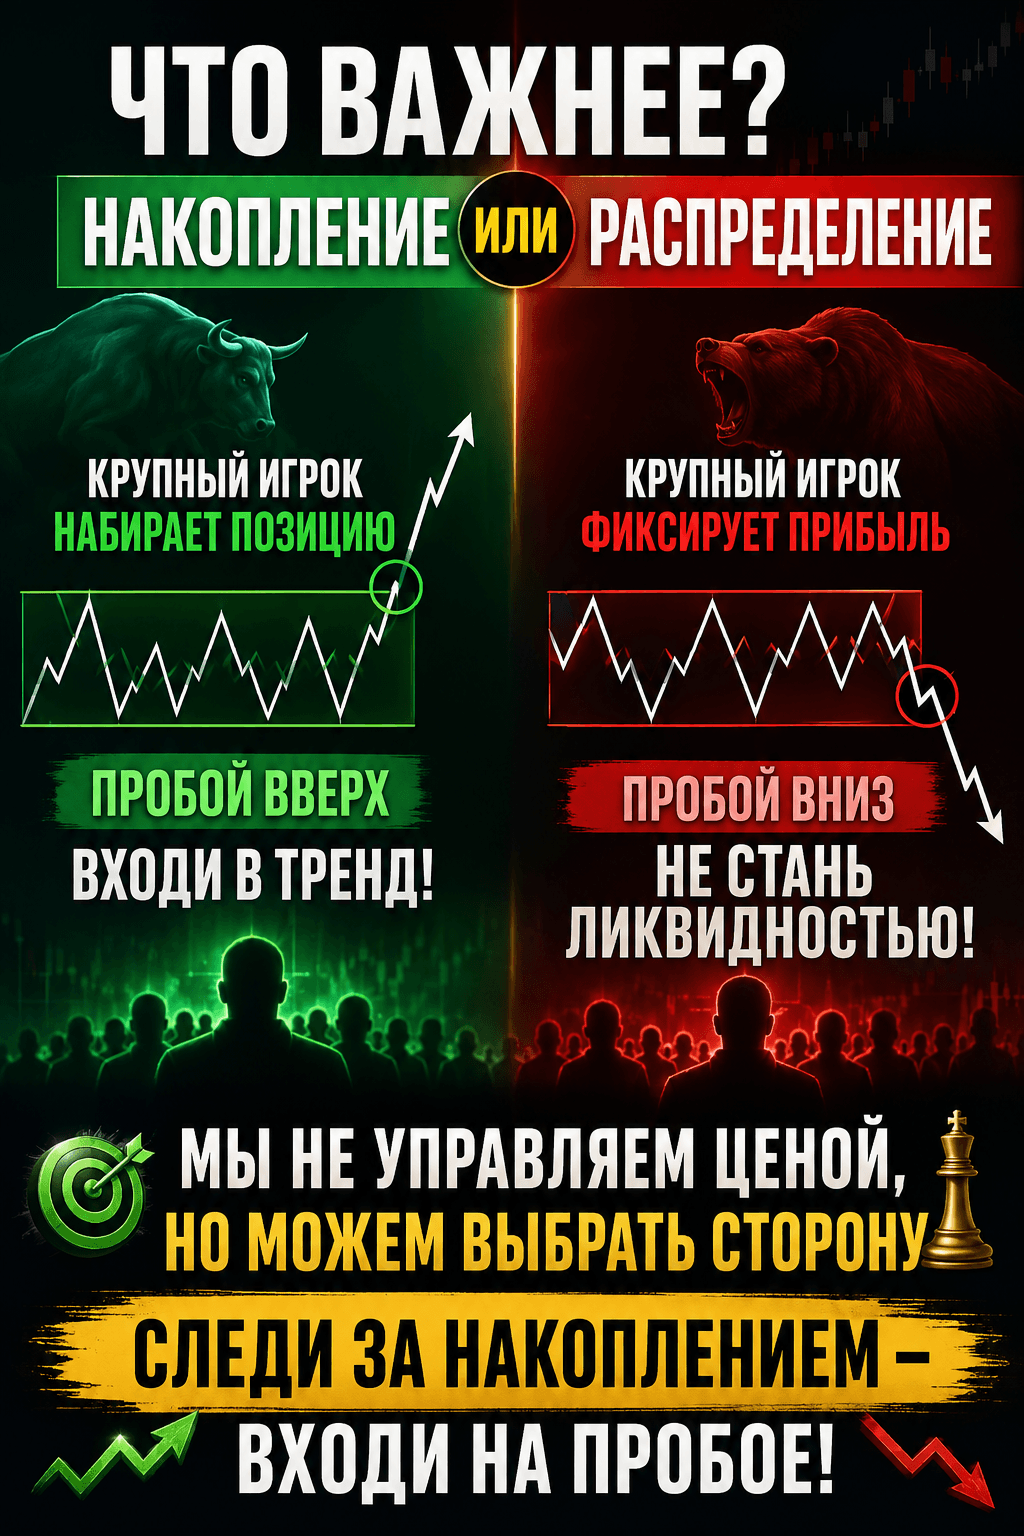 Accumulation or Distribution: Which Matters MoreWe don't move the price, we join positions already built by big players. That's why the question of where to enter - in a trend or on a breakout from an accumulation zone - isn't theoretical for me. It's about where in the move my entry actually lands.209
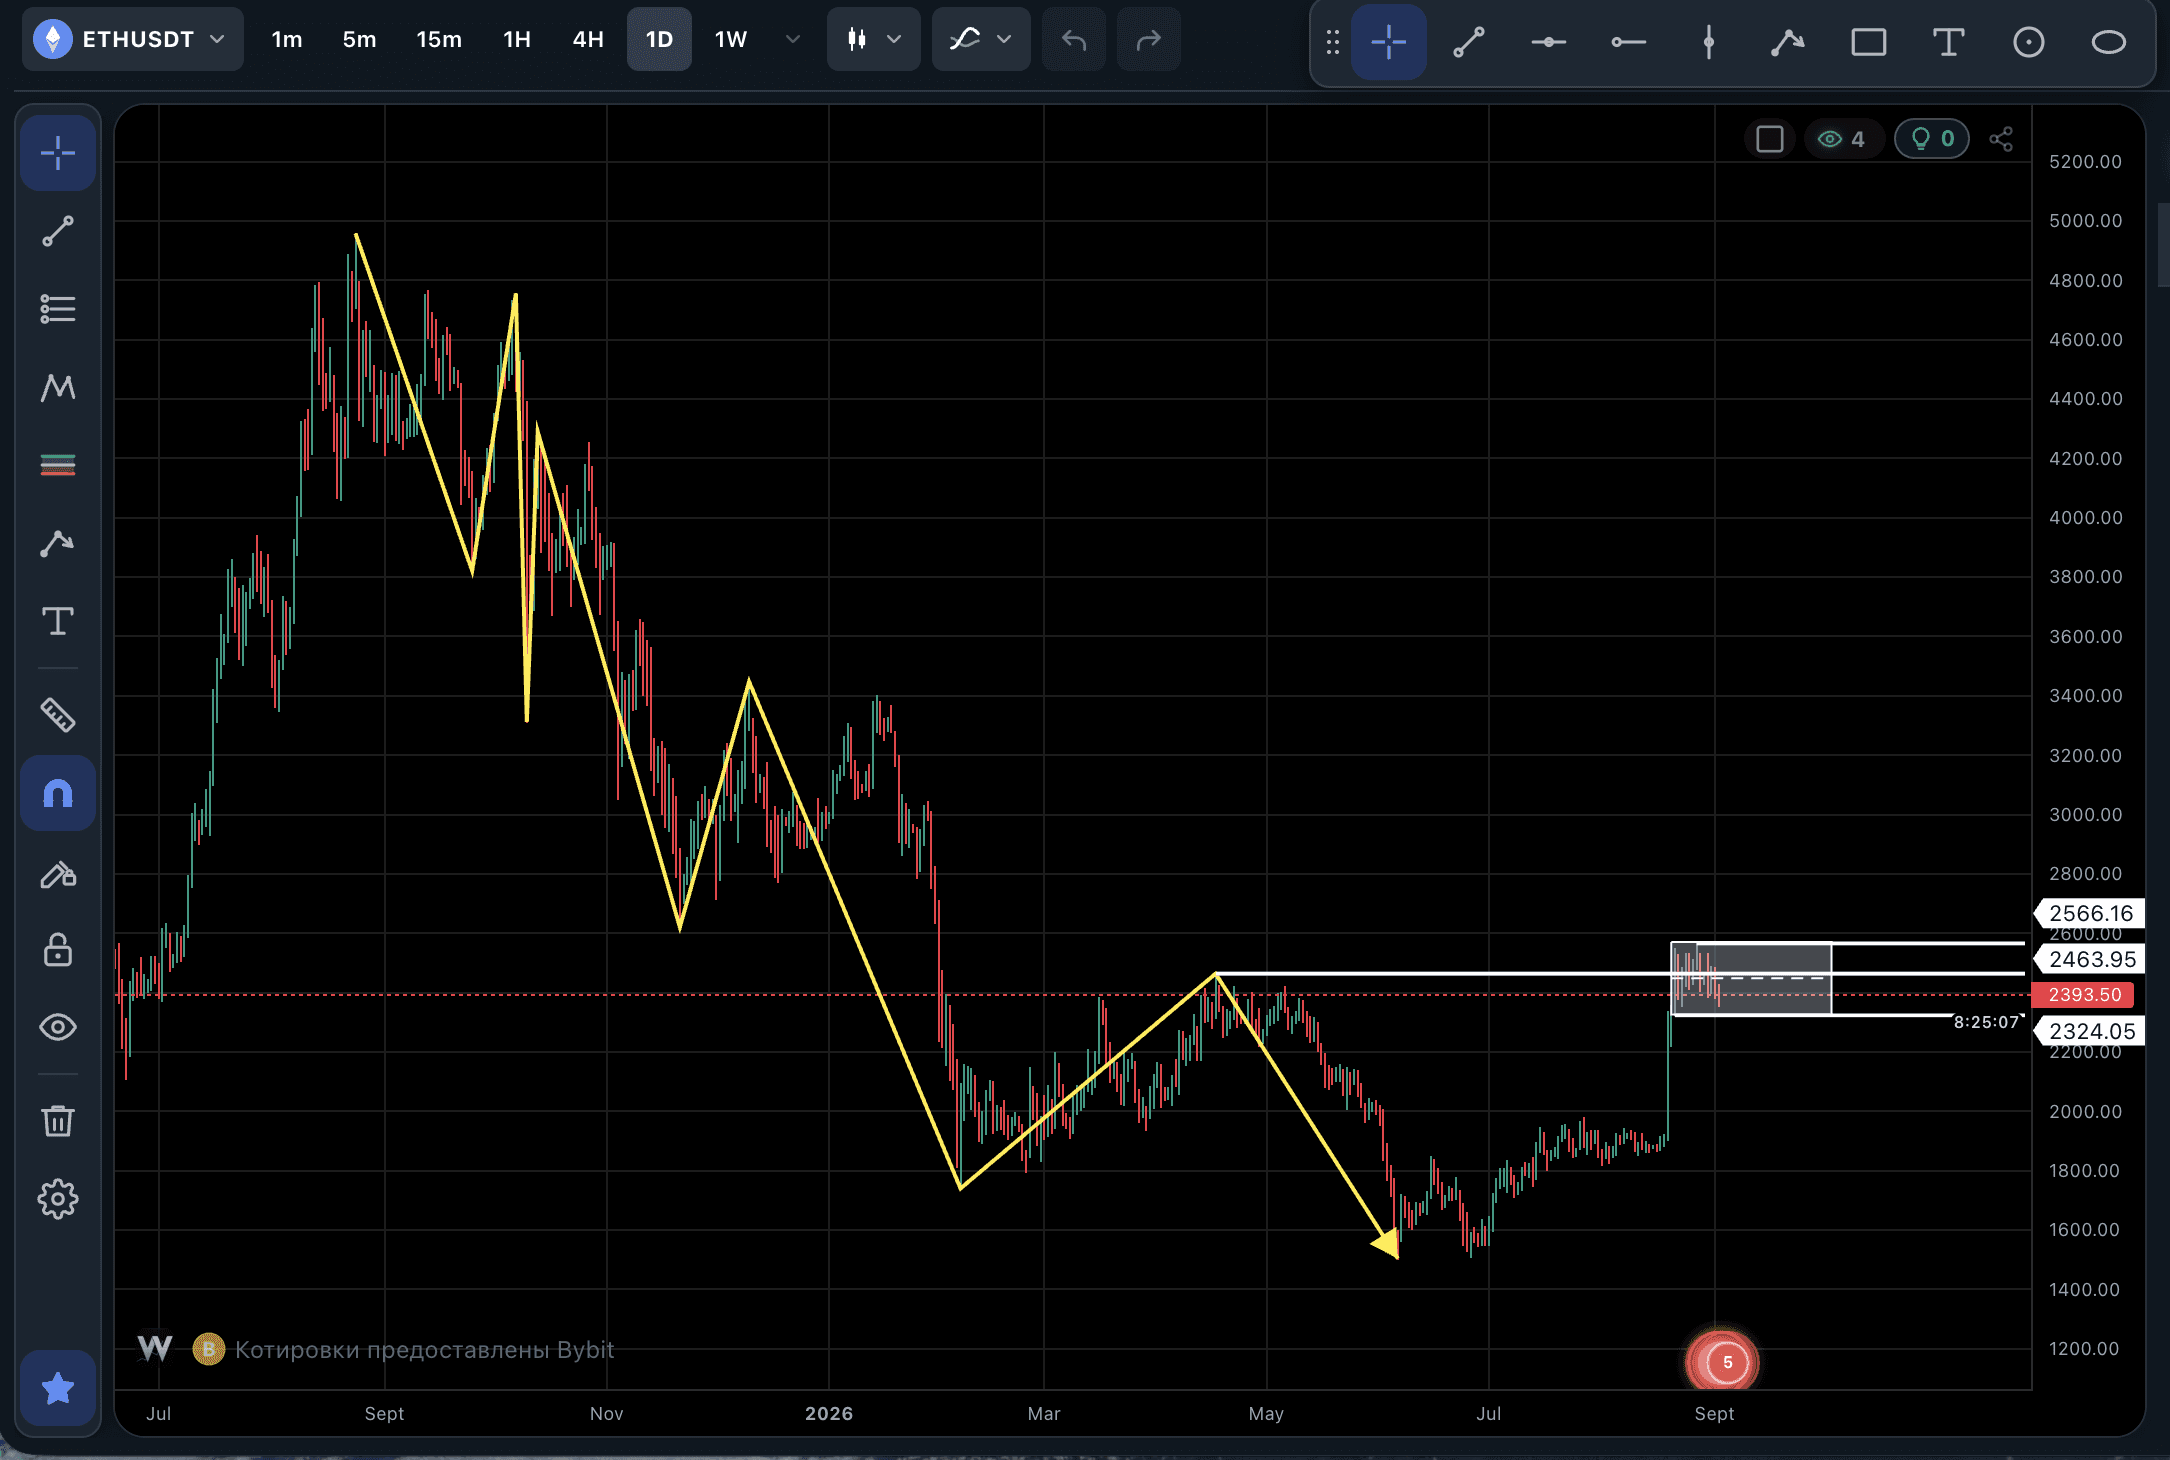 Ethereum: 2324-2566 accumulation zone, what's nextThe Ethereum situation almost mirrors what's happening with Bitcoin right now. There's a downtrend on the higher timeframe, an upward impulse inside it, and a level formed by a correction, sitting at 2463, which price has reached.139
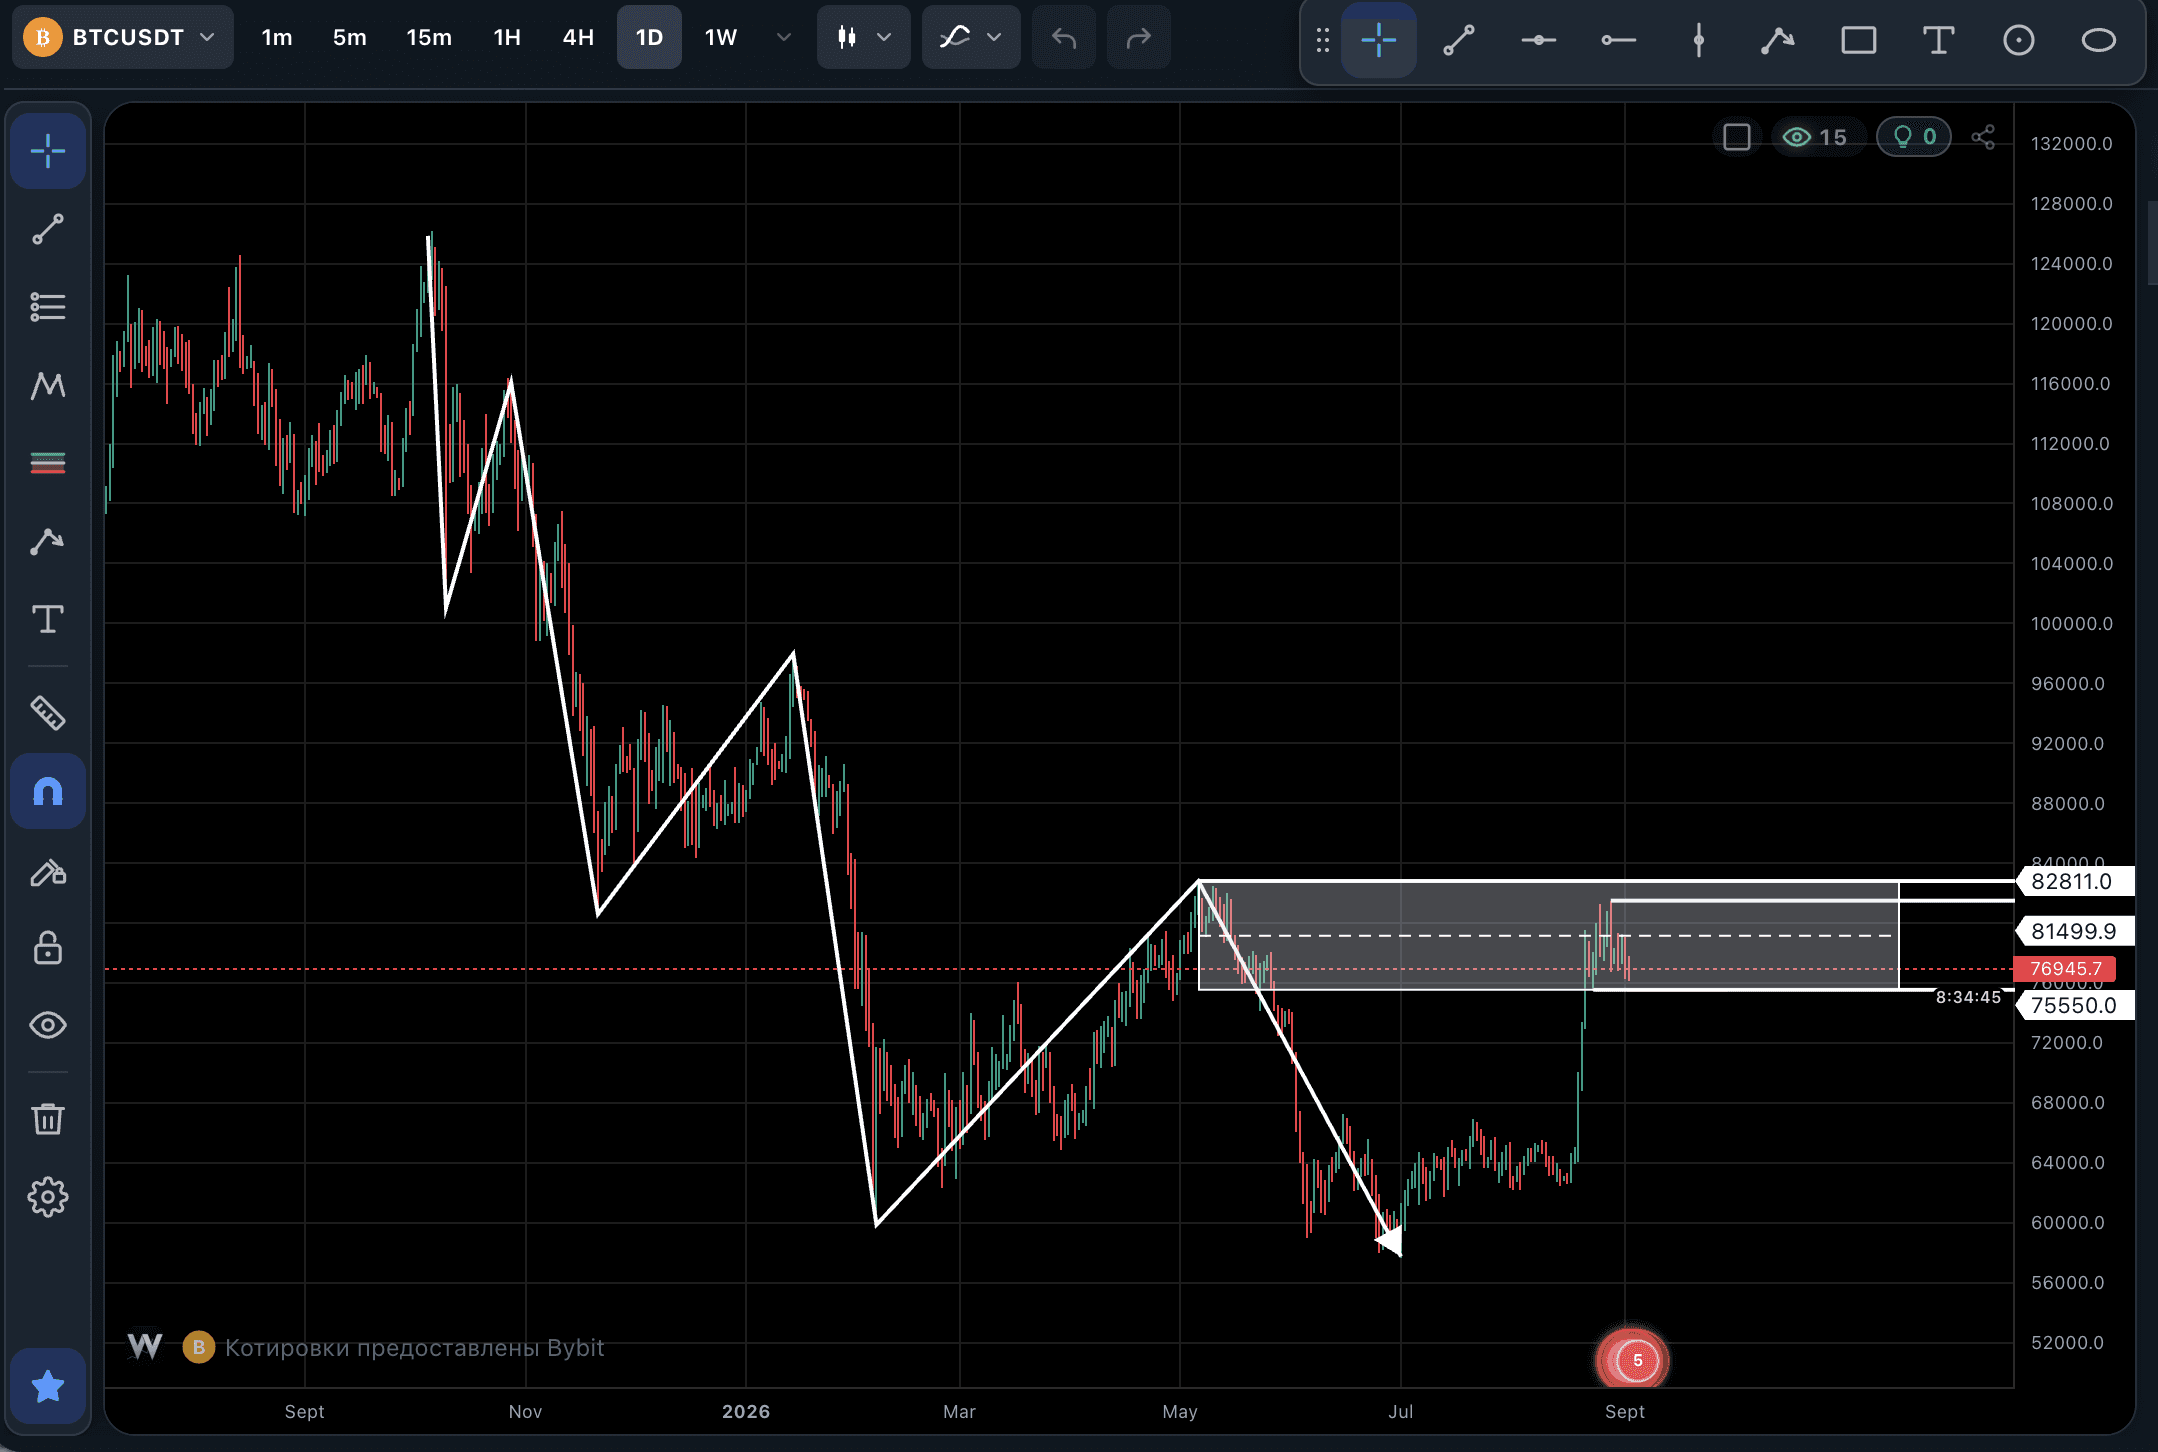 Trading Bitcoin's Accumulation Below ResistanceThe recent upward move was truly impulsive - sharp, with no long pauses. For me, its main value isn't the rally itself, but the fact that it let me pin down the current low of the long-term downtrend. Before that, the bottom point was debatable; now it's confirmed.108
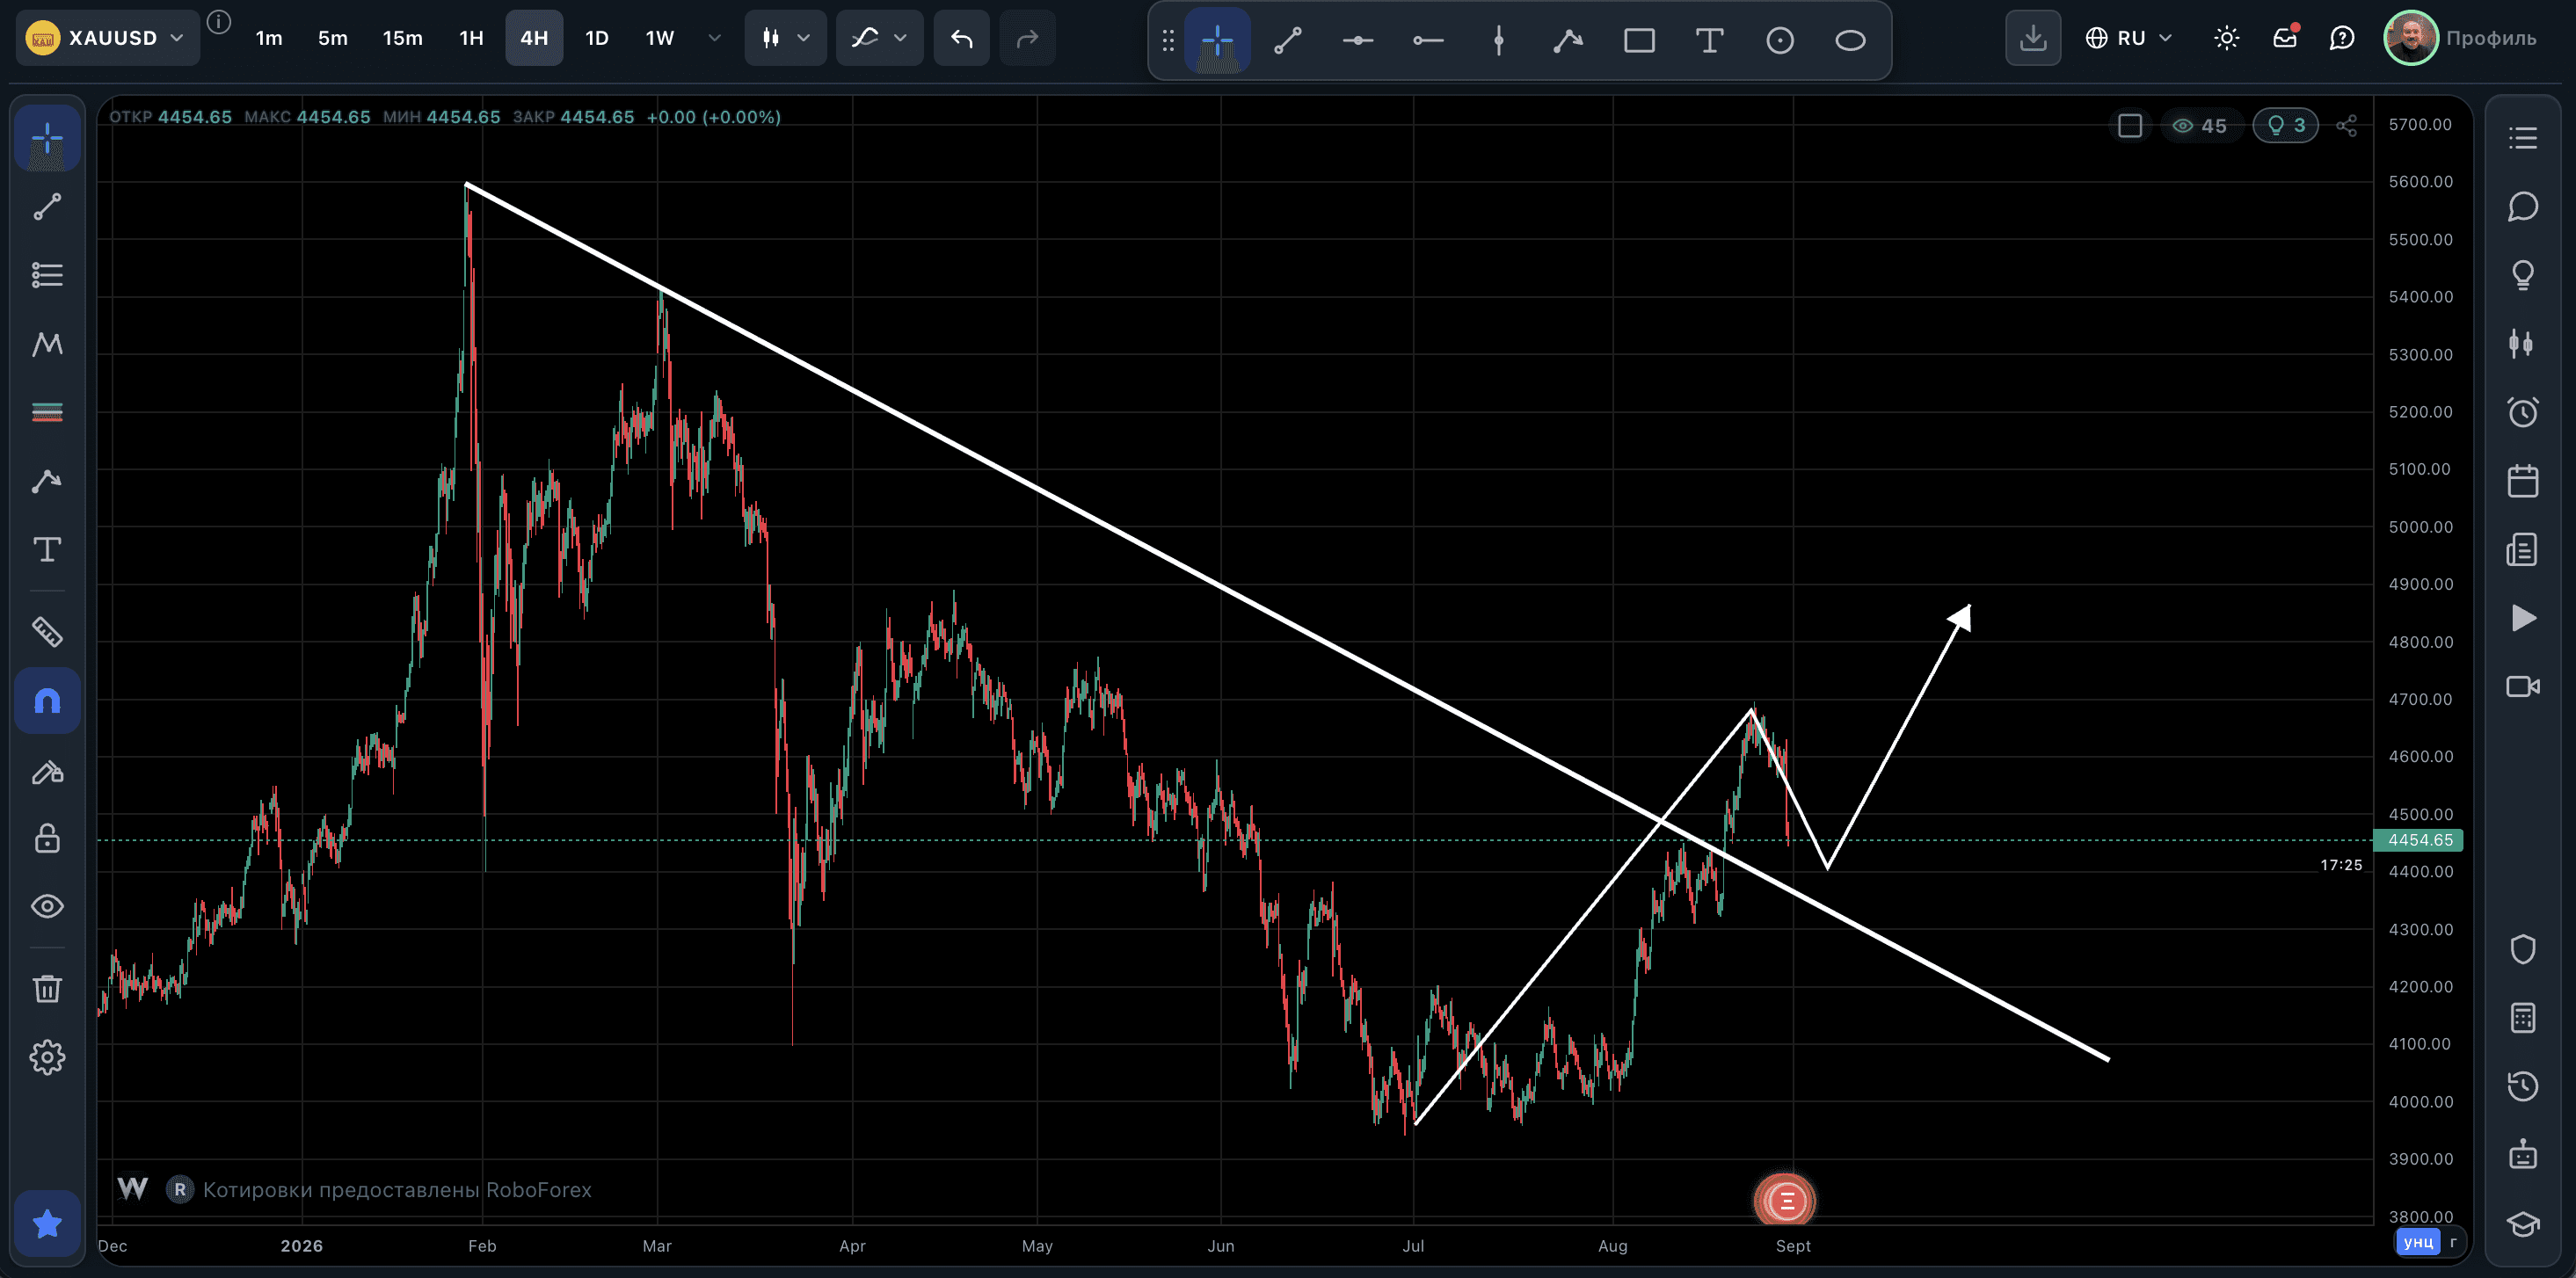 Gold XAUUSD: Sperandeo's Method After the BreakoutOn the daily chart, gold broke a long-term downward trendline. This is the first of three events I'm watching for under Sperandeo's method, and on its own it doesn't decide anything yet: a broken line is a bid for a trend change, not the trend change itself.205
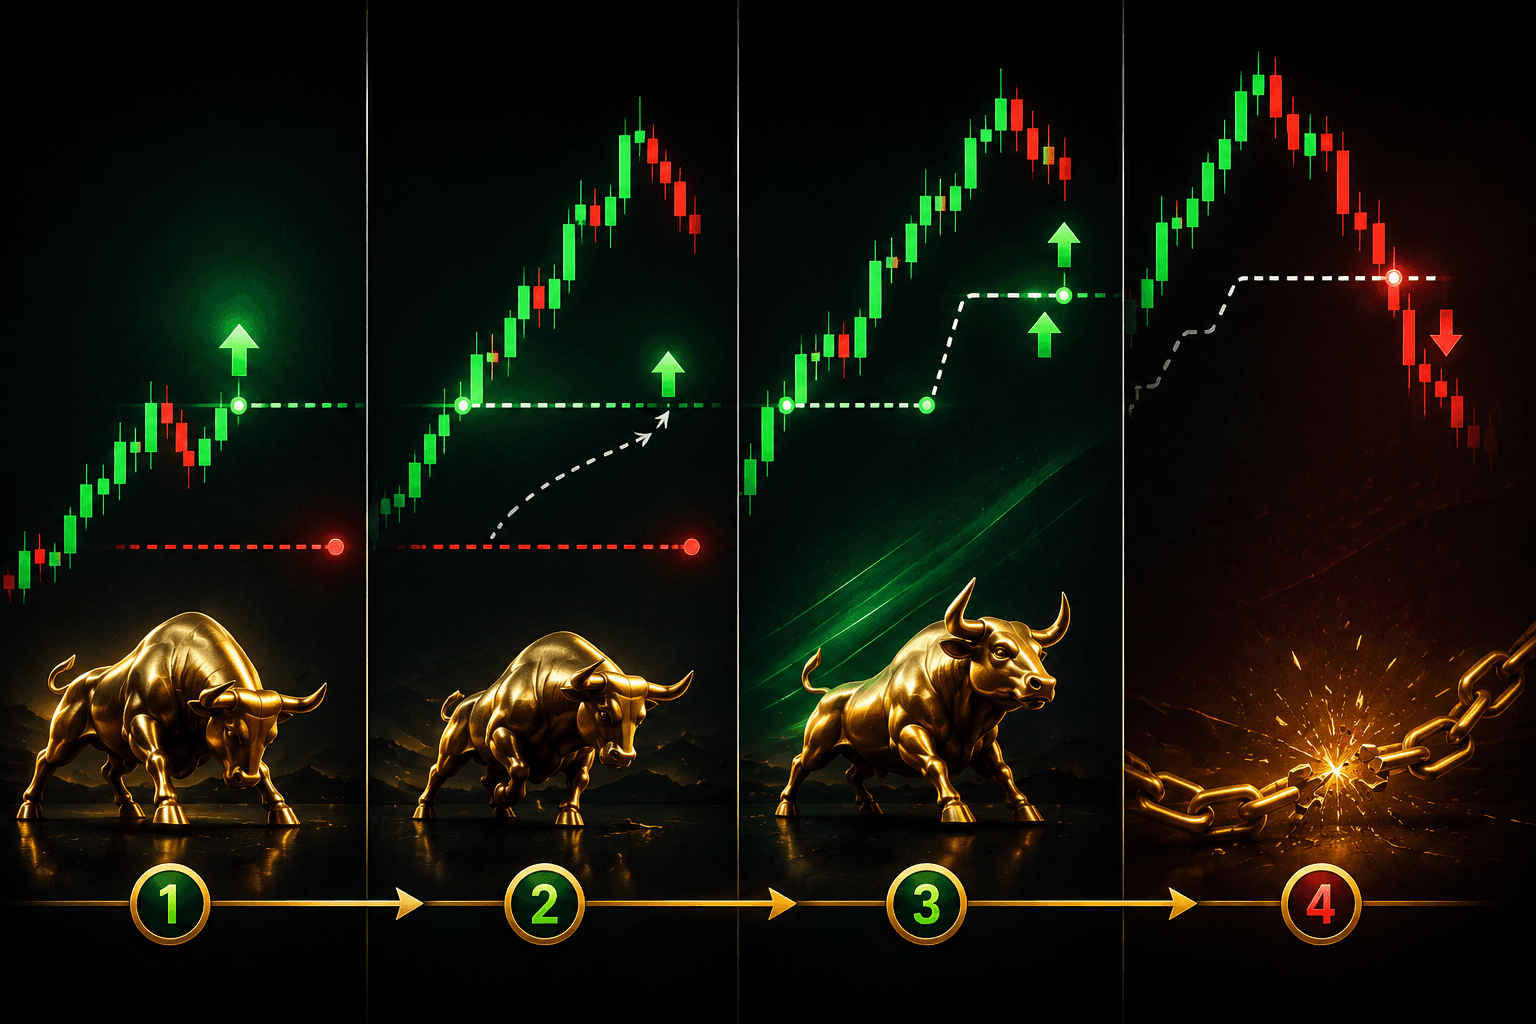 What Is a Trailing Stop and How Does It WorkA trailing stop is a stop-loss that automatically moves along with the price while a trade is going your way. You set a trailing distance, and the stop follows every new price extreme, keeping that same gap. As soon as the price reverses by the set distance, the position closes.237
 What Is Liquidity in Trading, Explained SimplyLiquidity is a property of the market that shows how easily you can buy or sell a large volume without a sharp price move. In simple terms, it's the market's ability to absorb trades. Not a reserve of money, not the total sitting in participants' accounts, but the readiness of the other side to accept your order at a close price.259
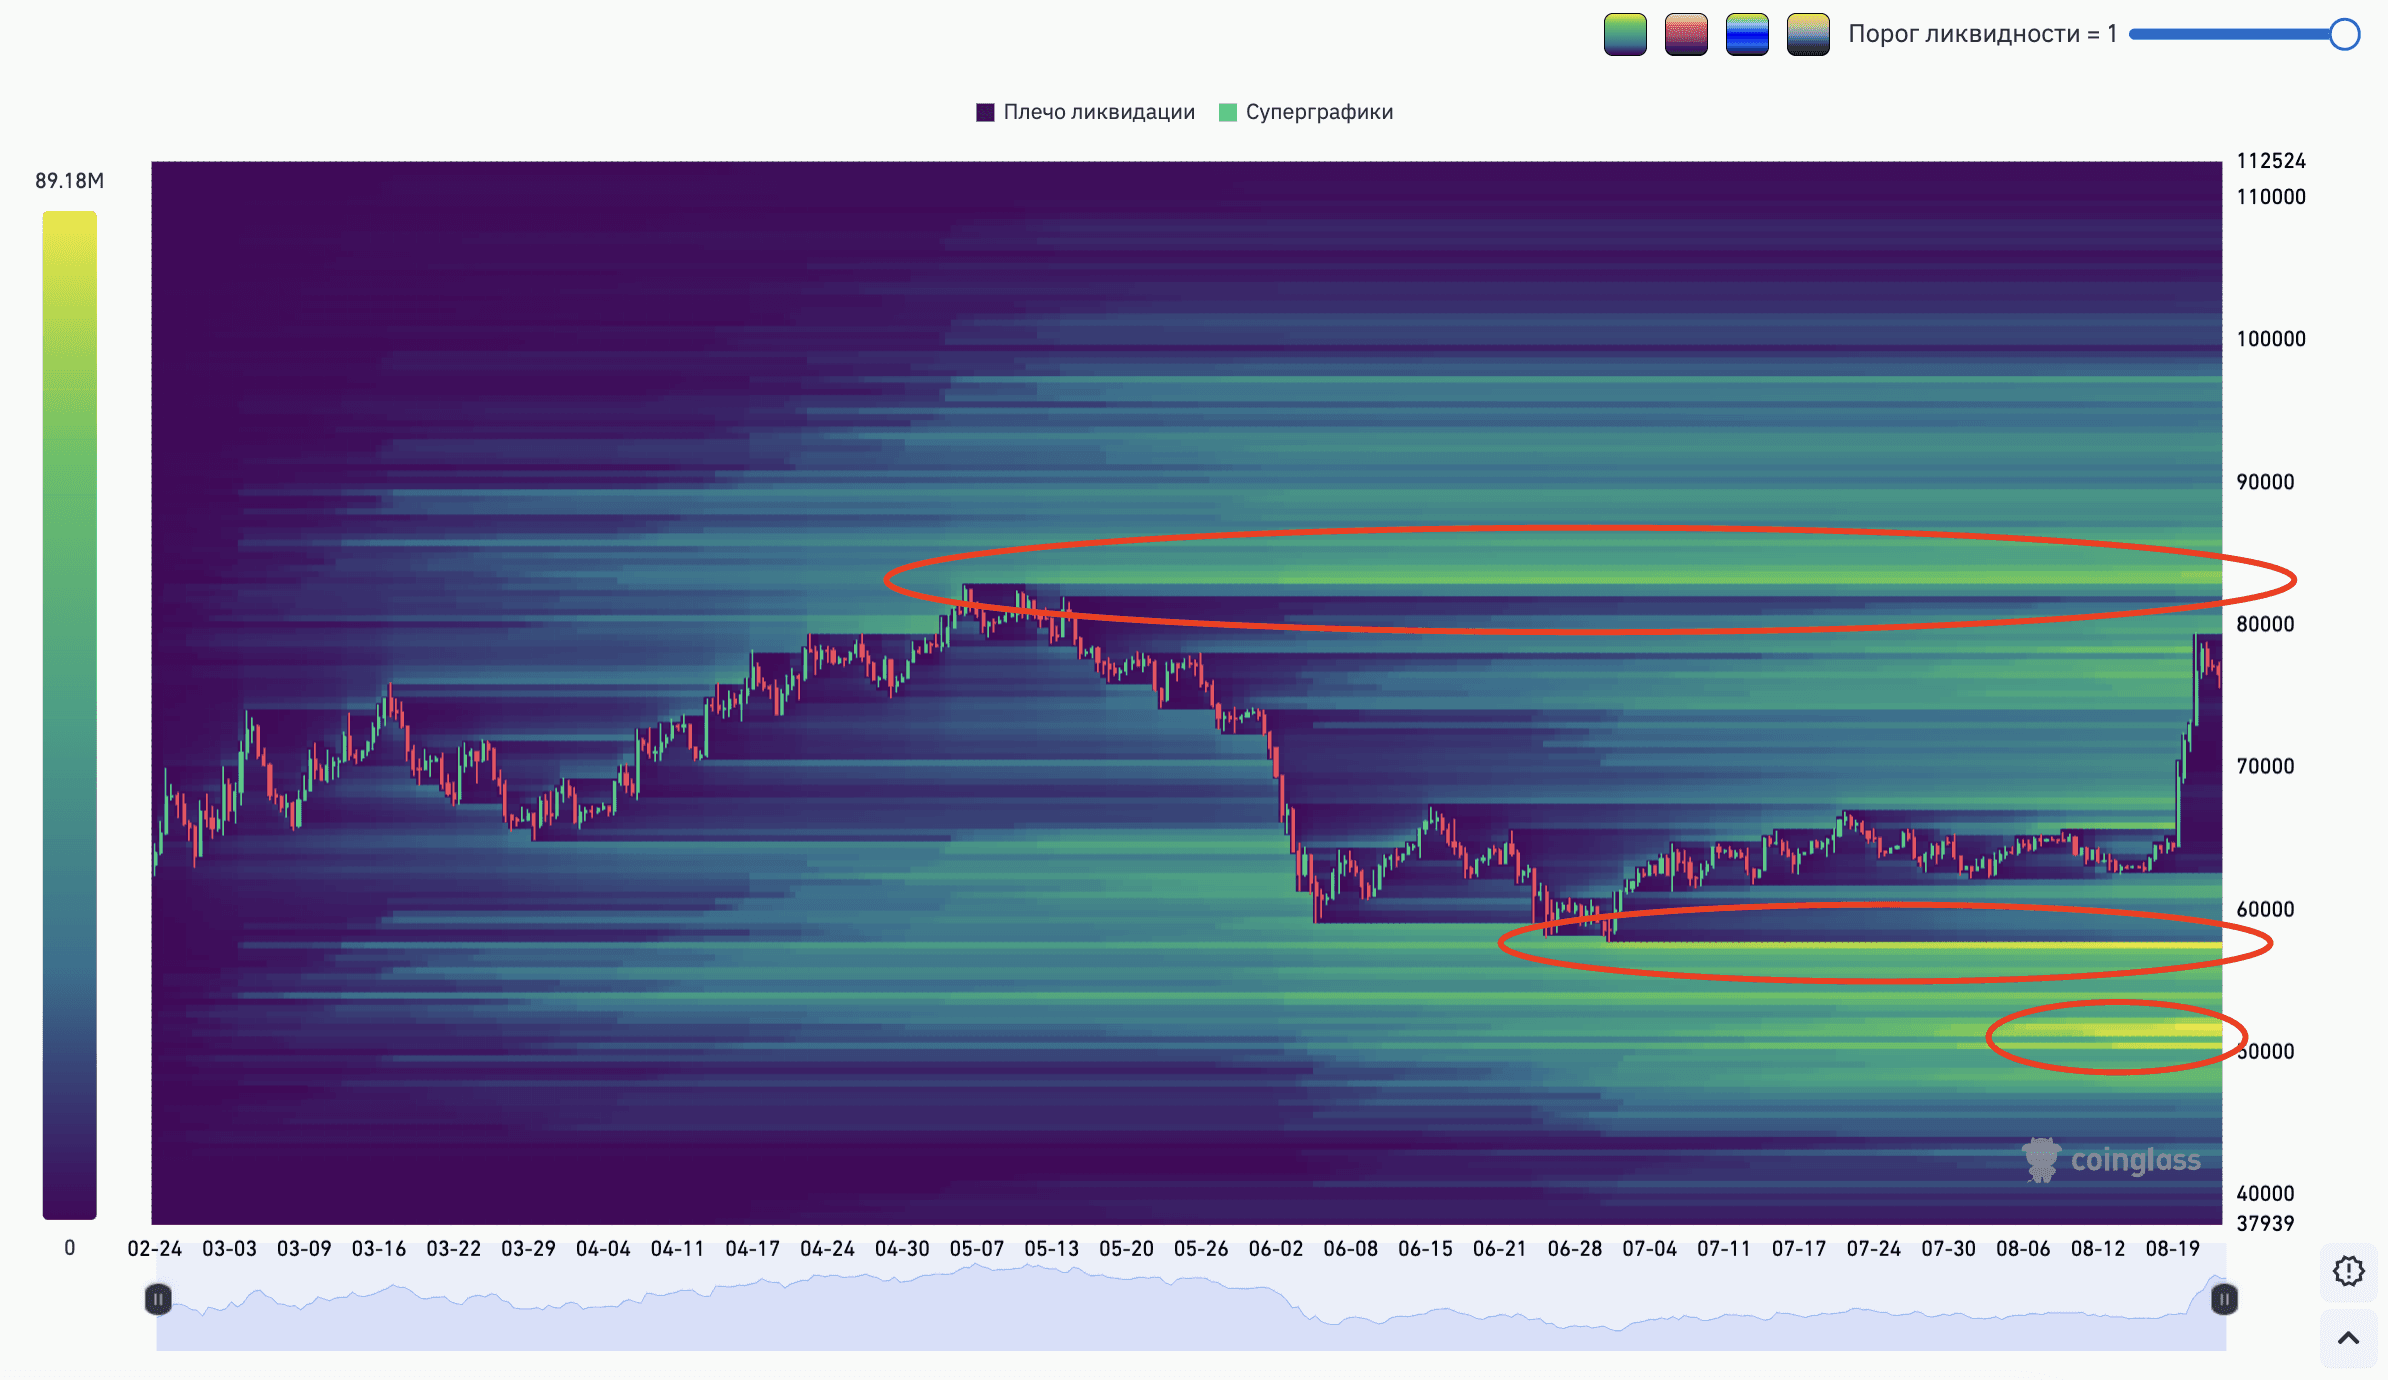 Liquidation Map and Structural AnalysisI never read the liquidation map separately from structure. On its own, it only shows clusters of leveraged positions - it's structural analysis that gives these clusters meaning, by showing where large players are sitting and which points on the chart matter for them.411
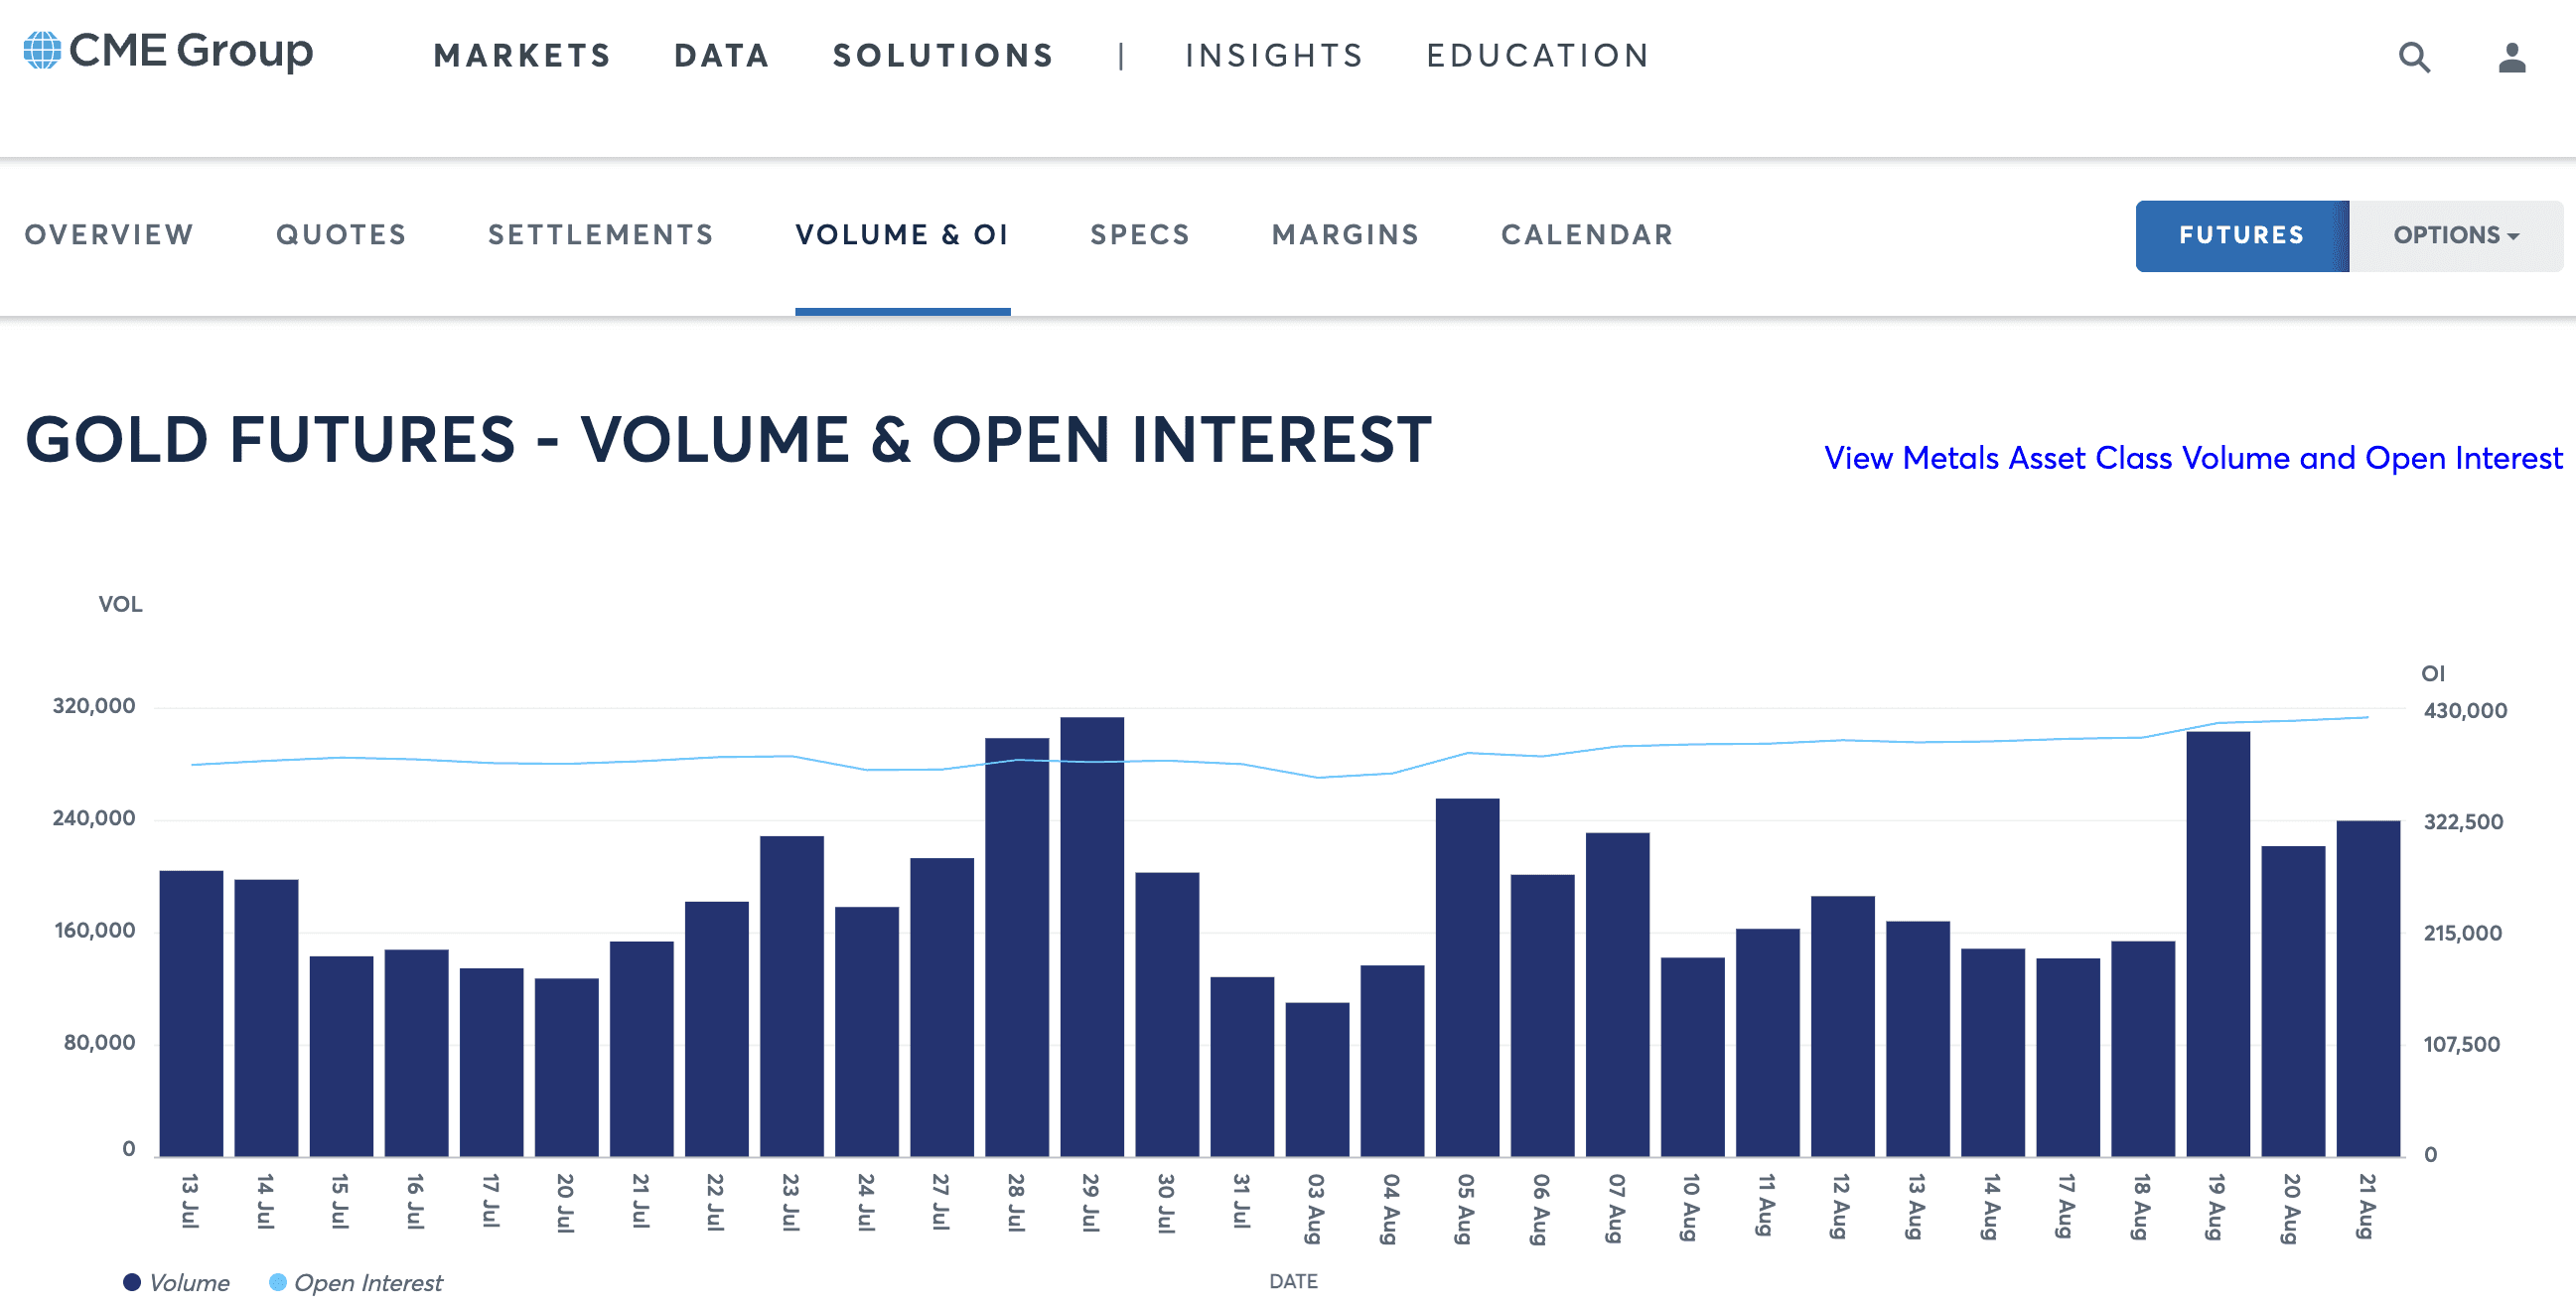 Rising Gold Open Interest: What It Means for the TrendI look at gold not just through candles, but through CME data too. Since early August, the picture there has been consistent: price rises, and open interest rises right along with it. To me that's a separate argument the candlestick chart alone can't give.283
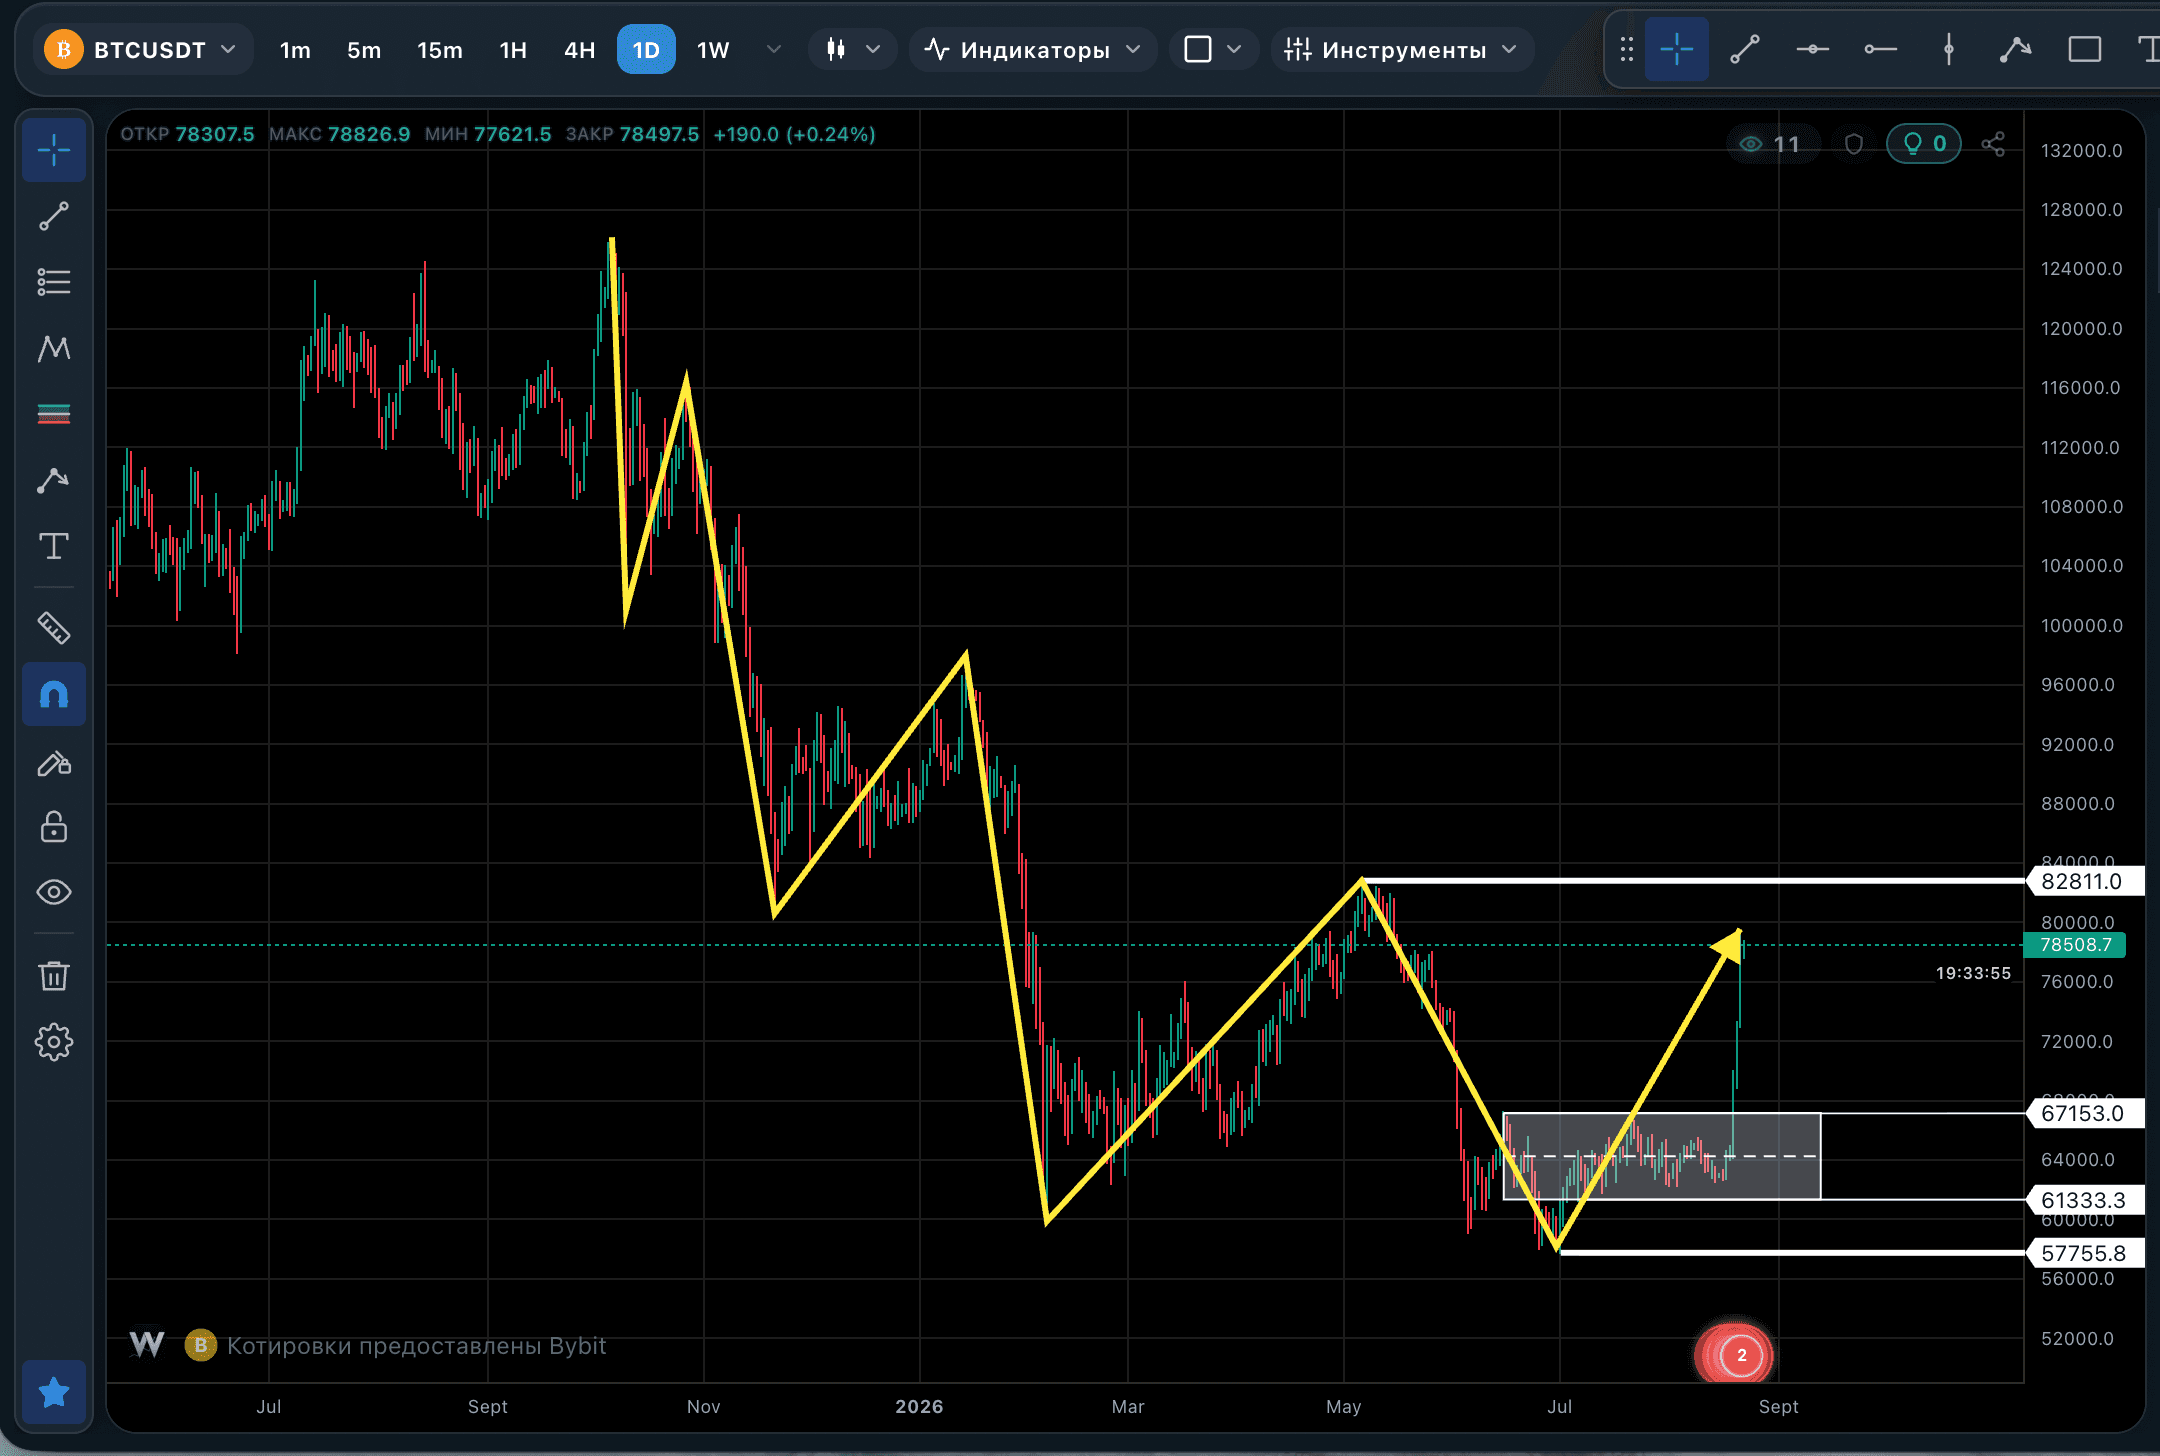 Bitcoin: Breakout Above 82811 or a Wide Range Ahead?After a lengthy accumulation phase in the lower part of the range, bitcoin delivered a strong impulsive move up. The range of recent weeks runs from 57755.8 to 81999, and price currently sits in the upper third of it, with the last close at 78307.5.205
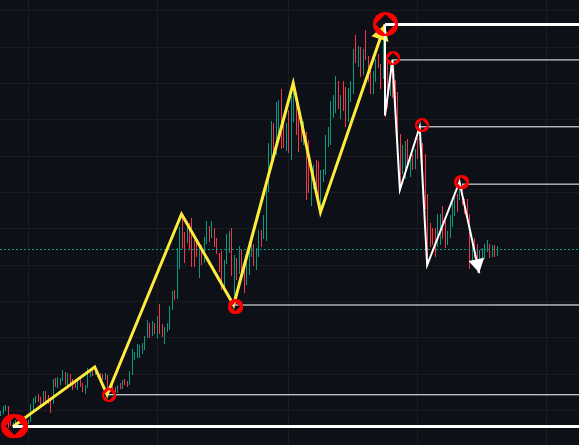 How to Properly Scale a Trading ChartI treat chart scale not as a matter of convenience but as part of the analysis itself. How much history fits into the window determines whether I see the targets of a move or just stare at a chunk of candles with nothing to go on.307
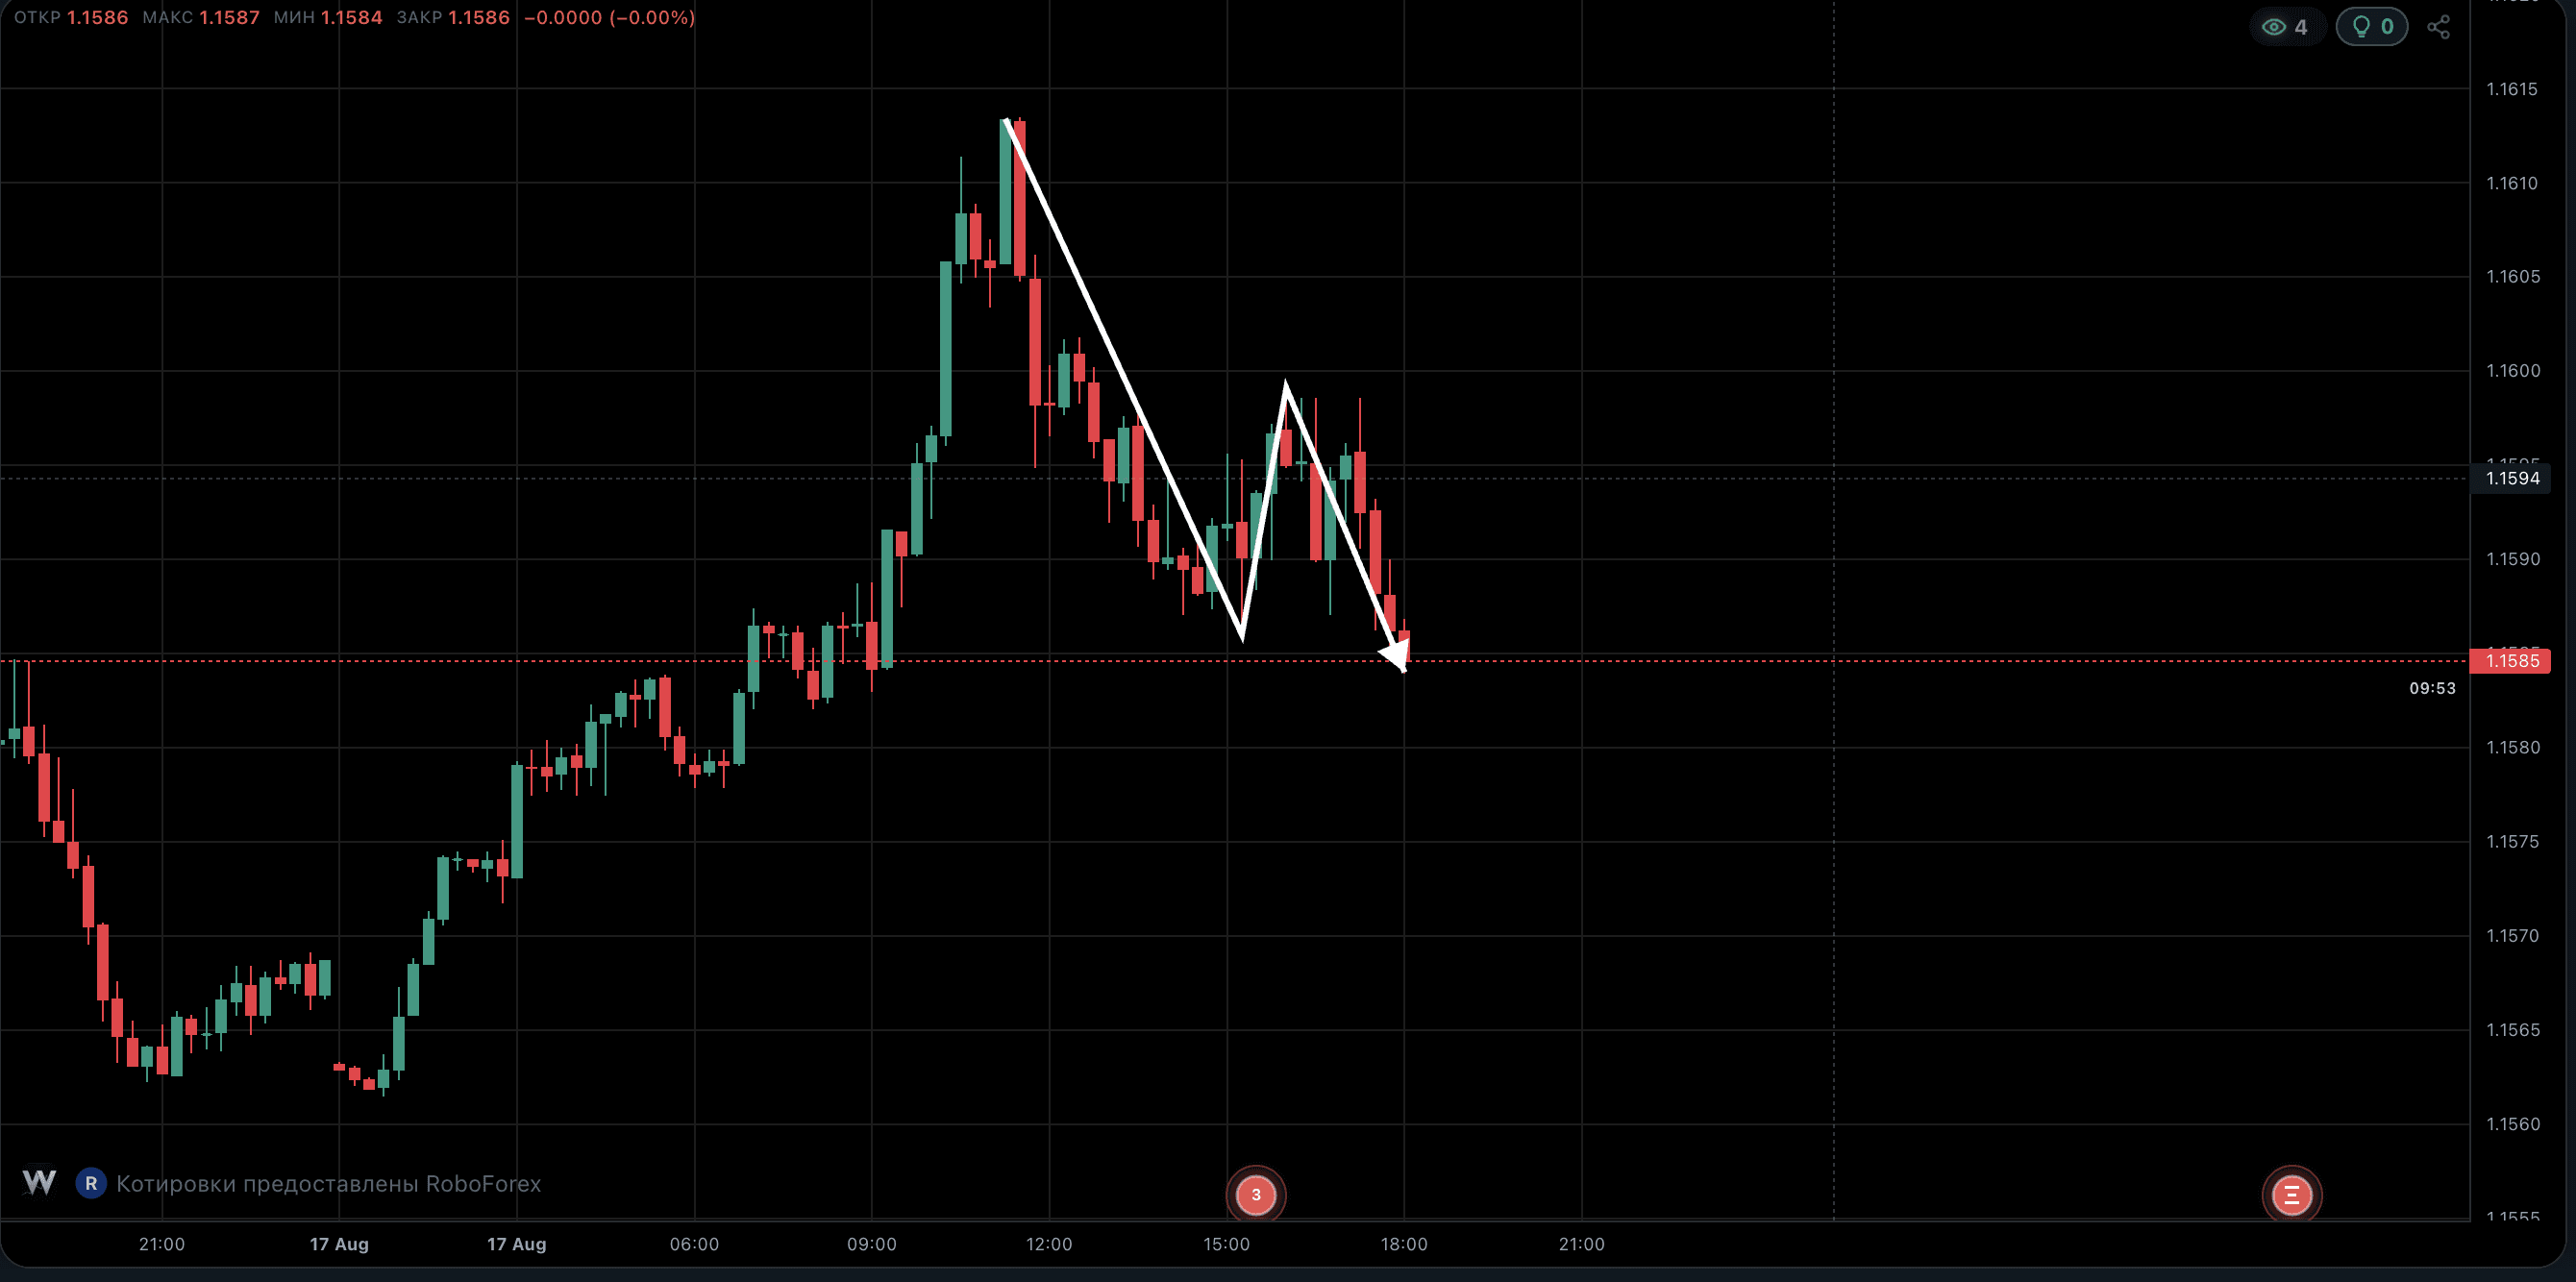 How to Spot a Trend on a Chart: Three MovesThe word "trend" gets slapped on almost any rally or drop, and that's where the confusion starts, right at the most basic level. On the chart the difference is visible with the naked eye, no indicators needed: you just have to tell a simple move apart from a complex one.285
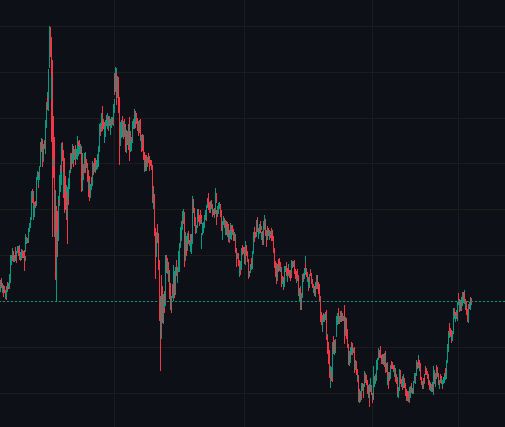 M1 vs D1: Where Big Players Really Show UpВопрос звучит просто: где искать мелких участников, а где крупных - на минутке или на дневке? Ответ не такой прямой, как хочется, но логика распределения активности по таймфреймам вполне читаемая.390
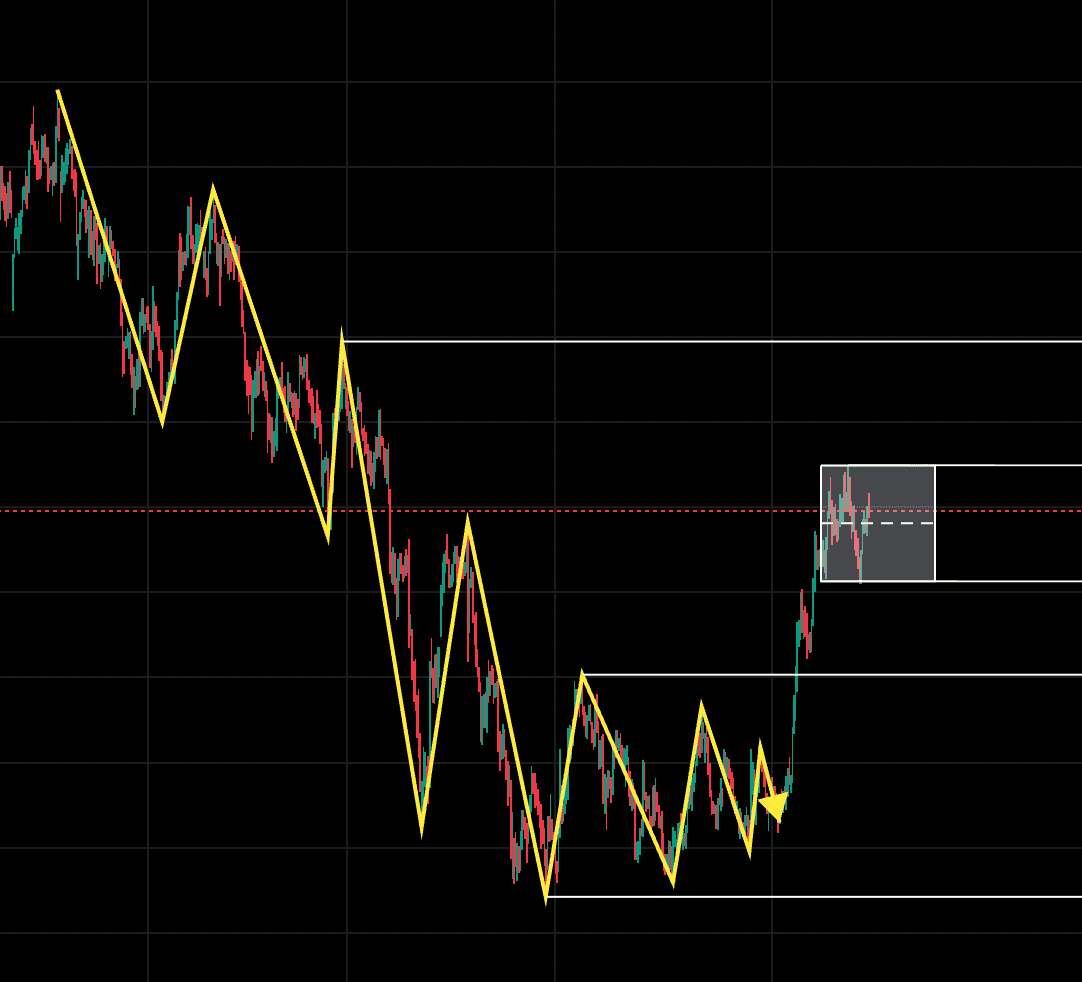 Gold: What Happens After the Range BreaksGold is trading inside a narrow 4450 - 4313 range, last closing price 4400.81. The actual price action of recent weeks almost matches these boundaries: 4317.89 on the downside and 4451.24 on the upside. In other words, price has already tested both sides several times without a confirmed breakout on either one.374
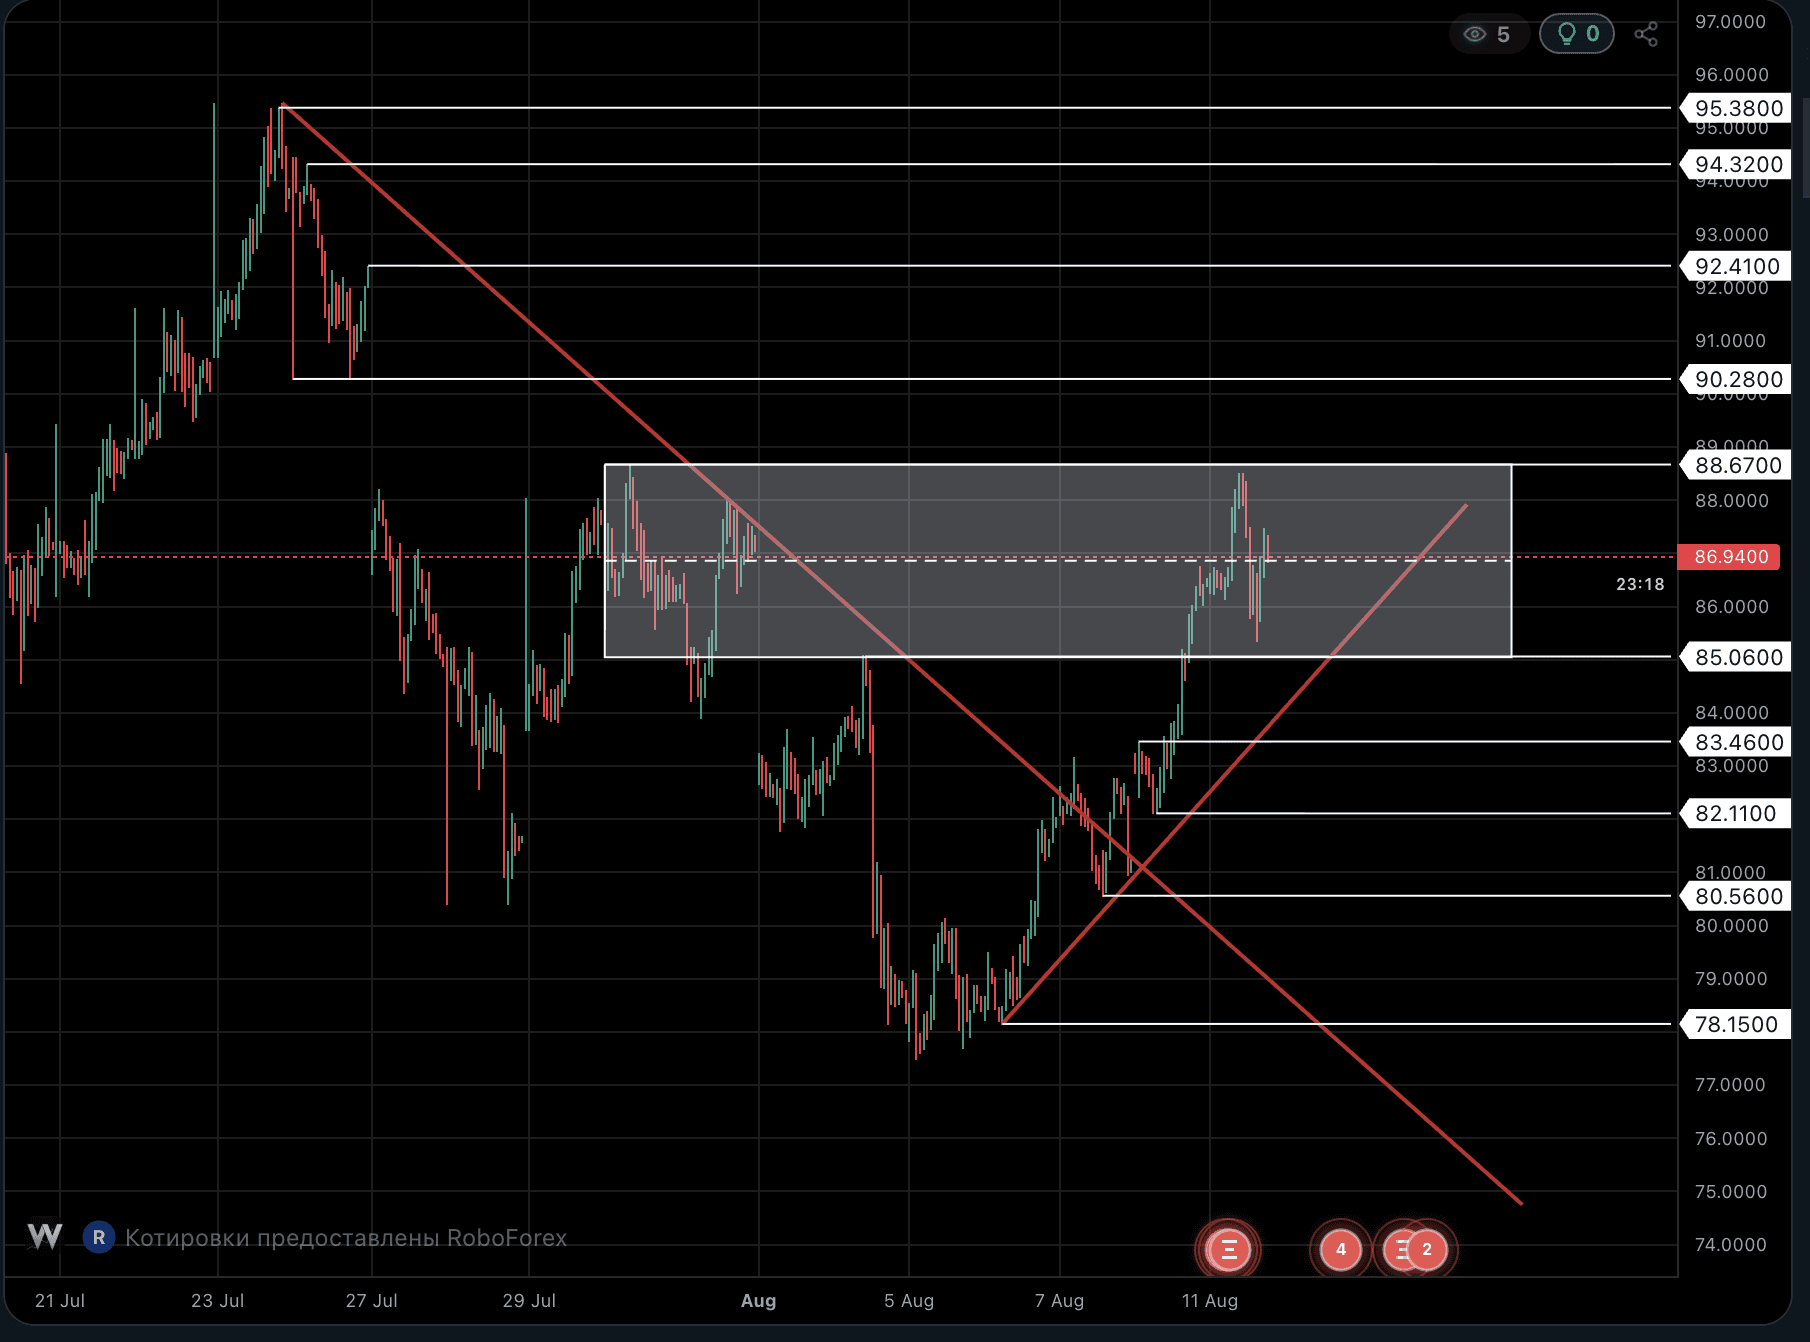 Brent Forecast: What Happens After the Third TestThe prior downtrend is broken - you can see it from the way price moved out from under the descending trendline and never came back to it. The current uptrend is still intact, the trendline below is holding, and I don't see a single close under it.90
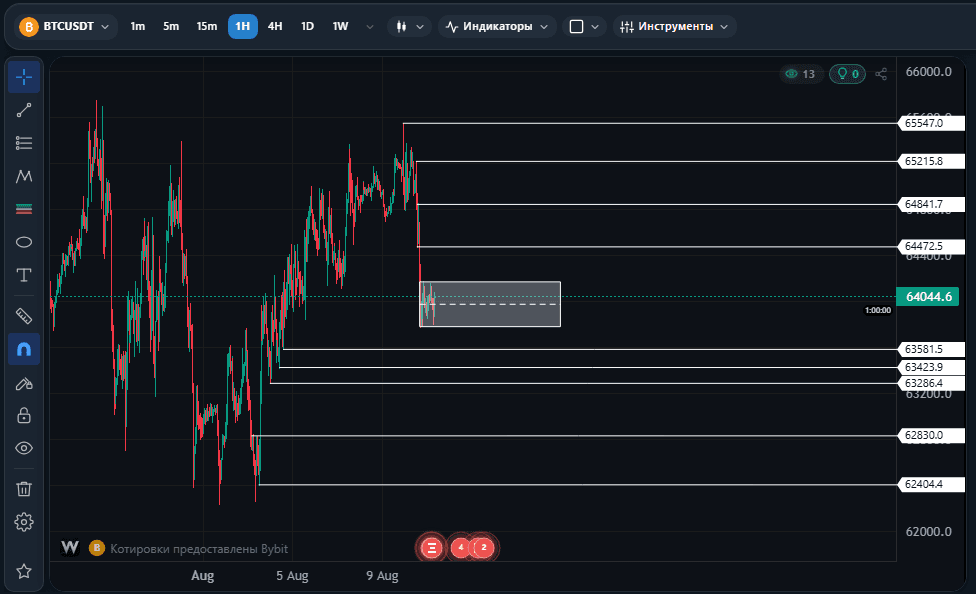 Bitcoin Range 63780-64170: A BreakdownAfter an impulse, price almost always either slows down or settles into a range. On Bitcoin's hourly chart, this is now visible in its purest form: the upward move broke off sharply, and price is squeezed between 63780 and 64170. The last close was 64034.9, right in the middle of this range.86
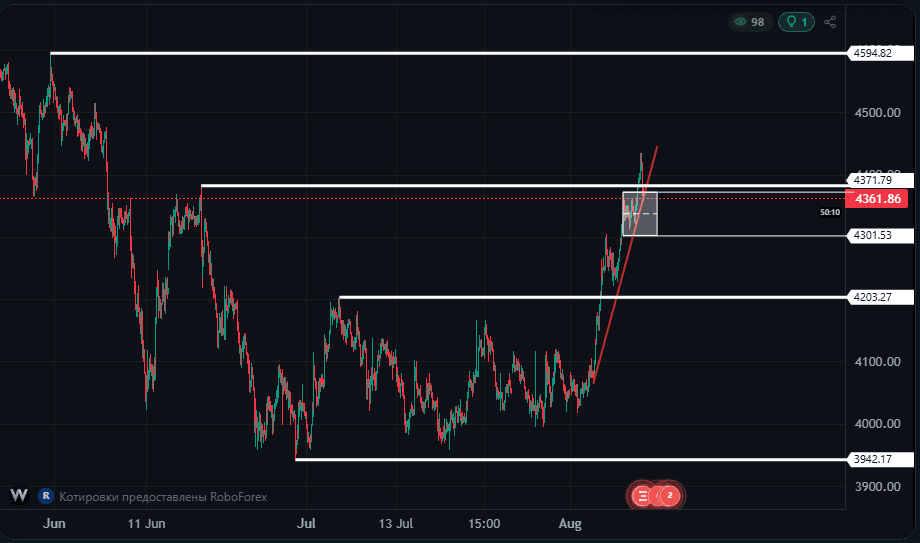 Gold 4382: Will the Uptrend Hold**What the price has done**140
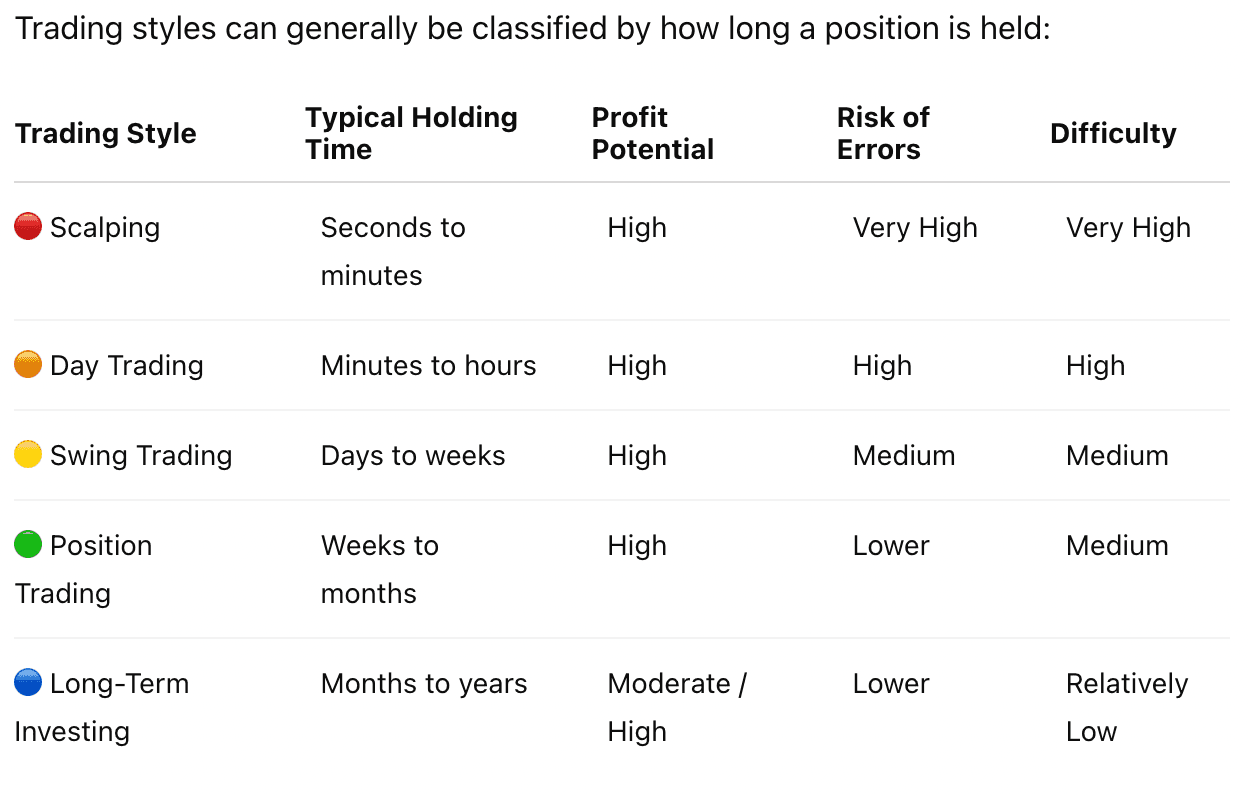 Which Trading Style Is More Profitable: Scalping or Position Trading?When choosing a trading style, traders often ask themselves: which type of trading can generate more profit, and which one is more likely to lead to significant losses?104
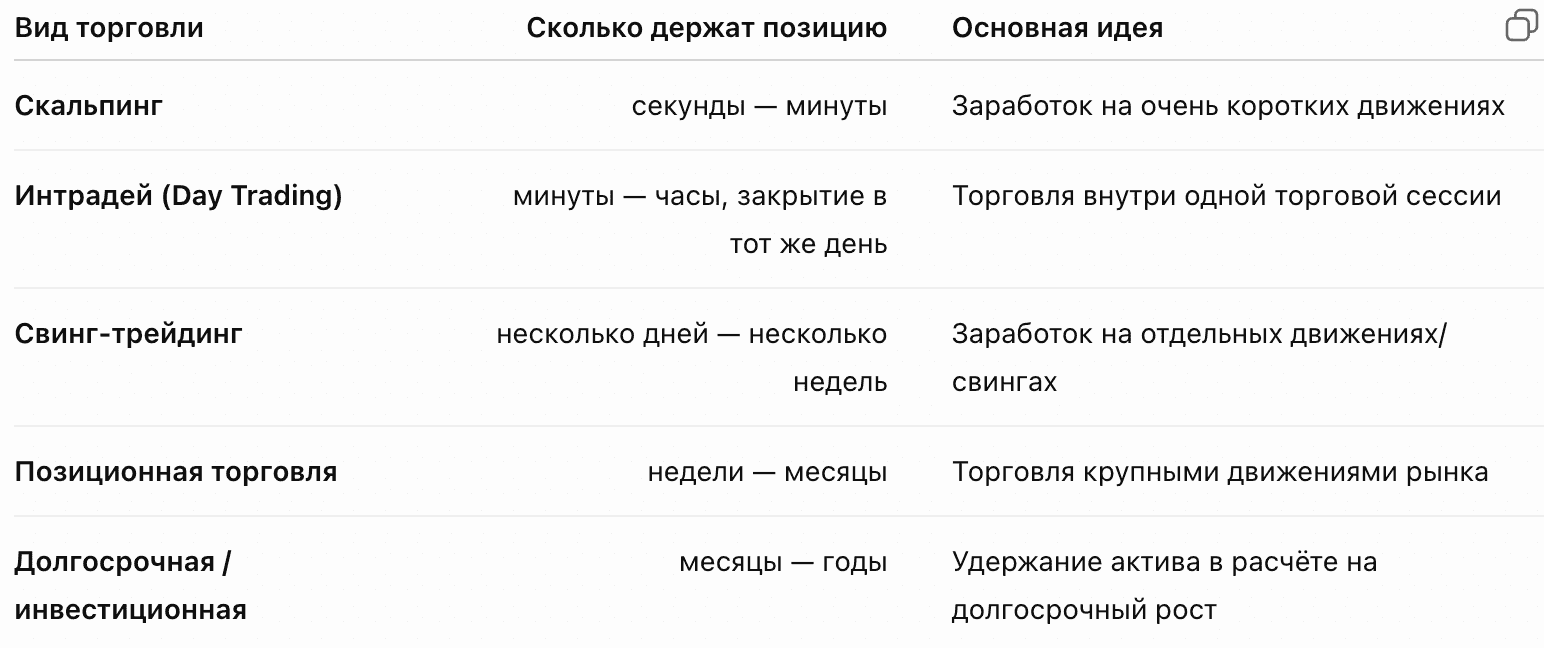 Types of Trading: From Scalping to Long-Term InvestingTrading in financial markets can be classified in several different ways. One of the simplest approaches is to classify trading based on how long a position is held.53
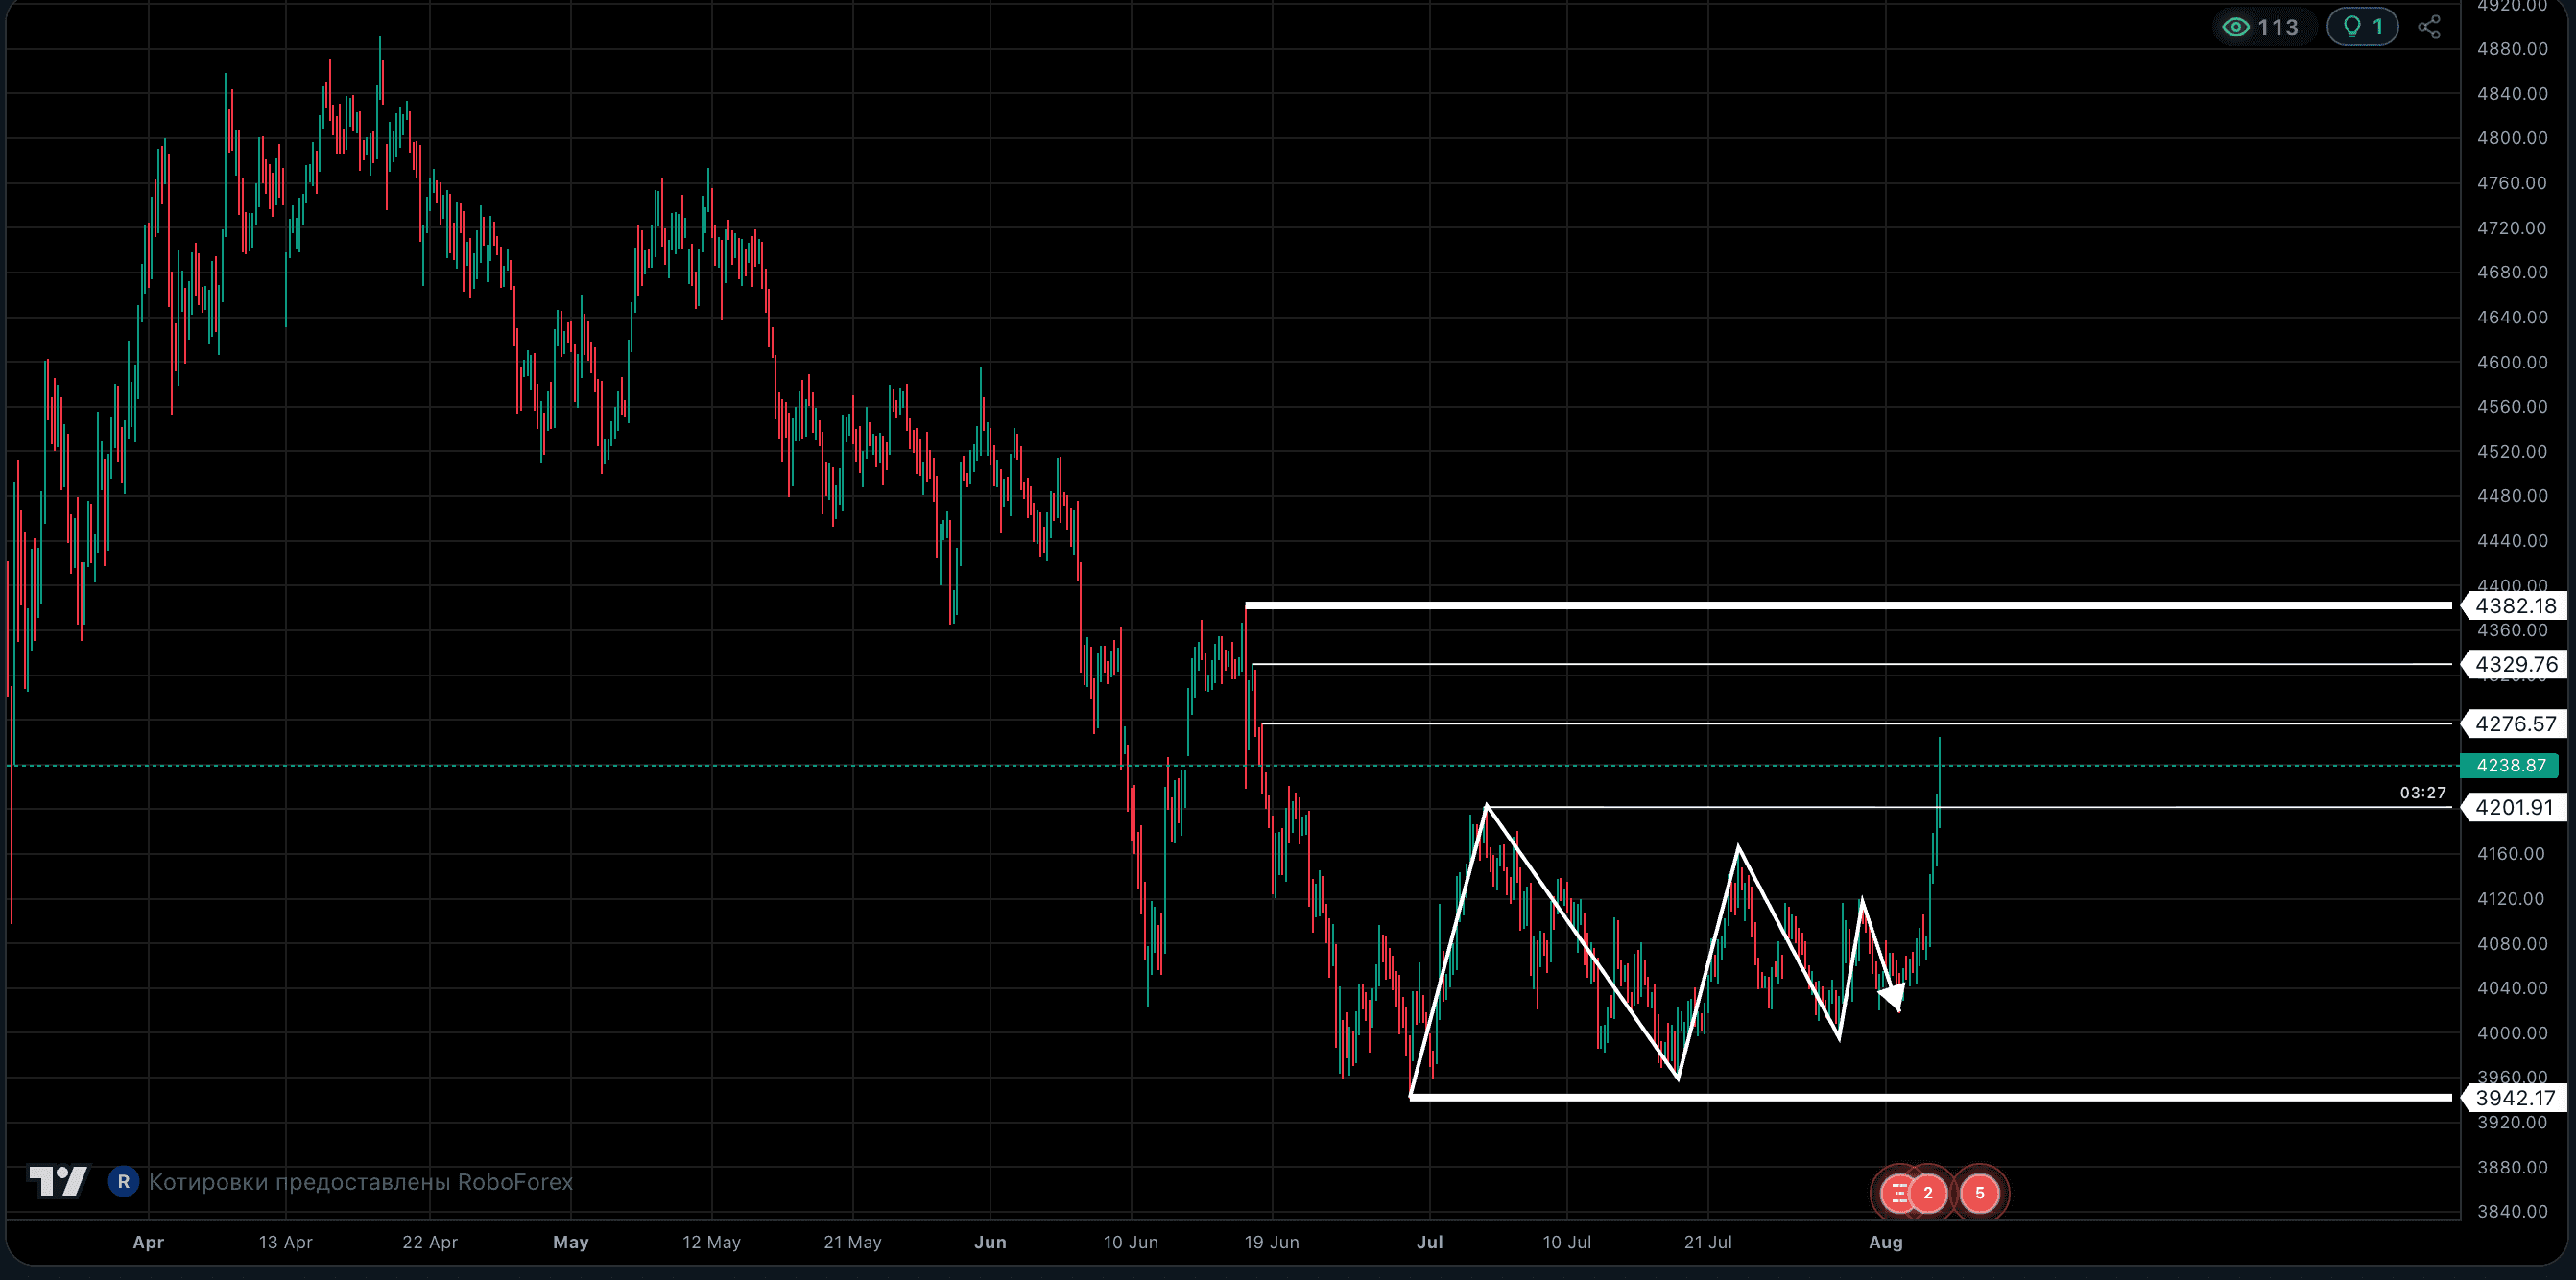 Gold (XAUUSD): Breakout from a Month-Long Accumulation Opens the Door to New HighsToday, the gold (XAUUSD) chart delivered an important technical signal. Price broke above the 4,203 resistance level, which had capped the market for more than a month.87
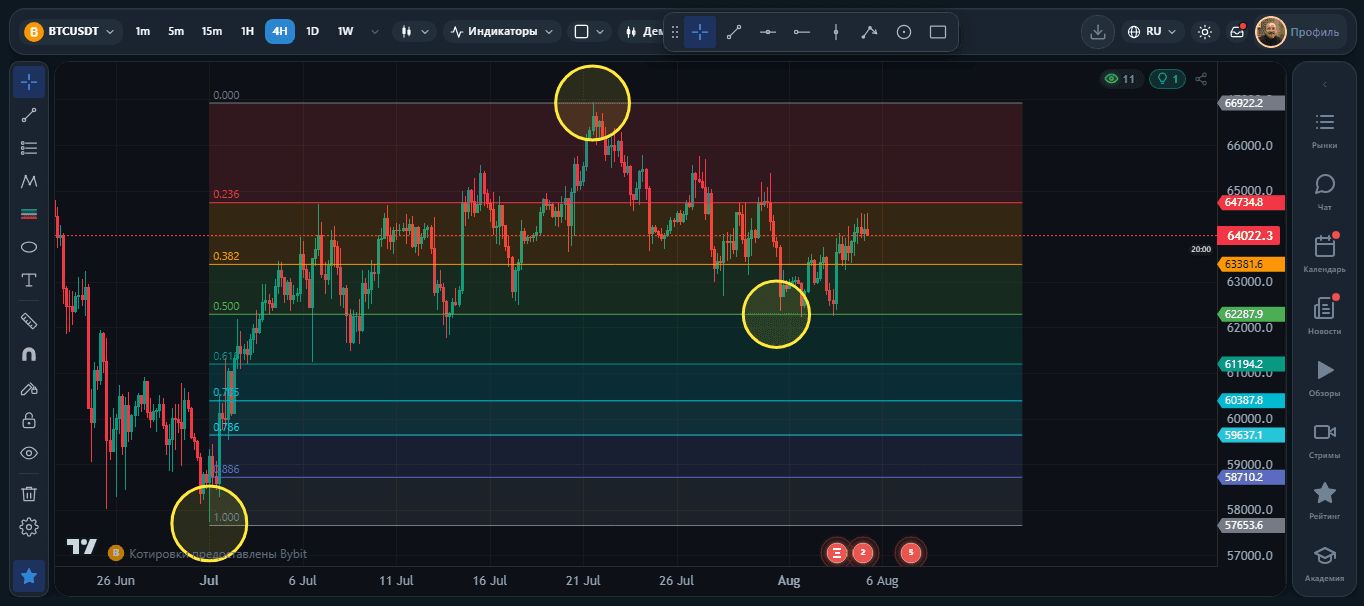 Levels 0%, 50%, and 100% - How to Identify Key Market Levels on Gold (XauUsd) and Any Other Chart 📈Even if you're not yet familiar with technical analysis, this information is easy to understand and can be extremely useful. You don't need to master dozens of indicators or complicated trading strategies to start reading the market. Sometimes, understanding just a few key price levels is enough.77
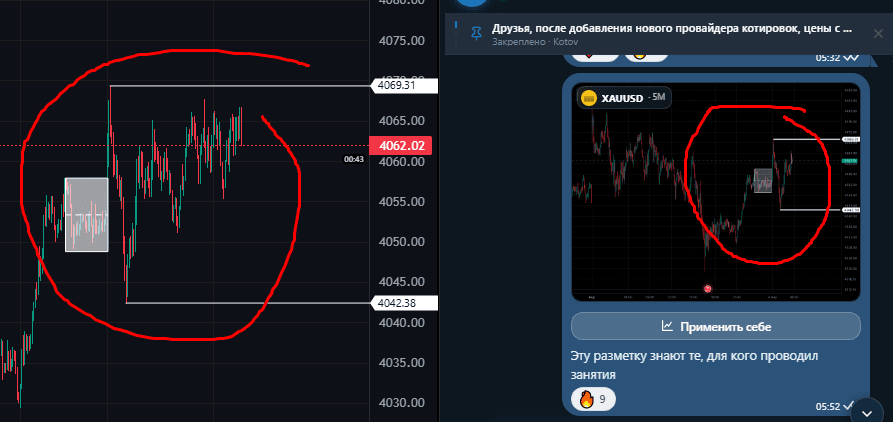 Why Understanding Market Logic Matters More Than Predicting Price 📈Many traders try to predict where the market will move in the next minute, hour, or day. As a result, decisions are often driven by emotions, and trades are opened only after the main move has already taken place.60
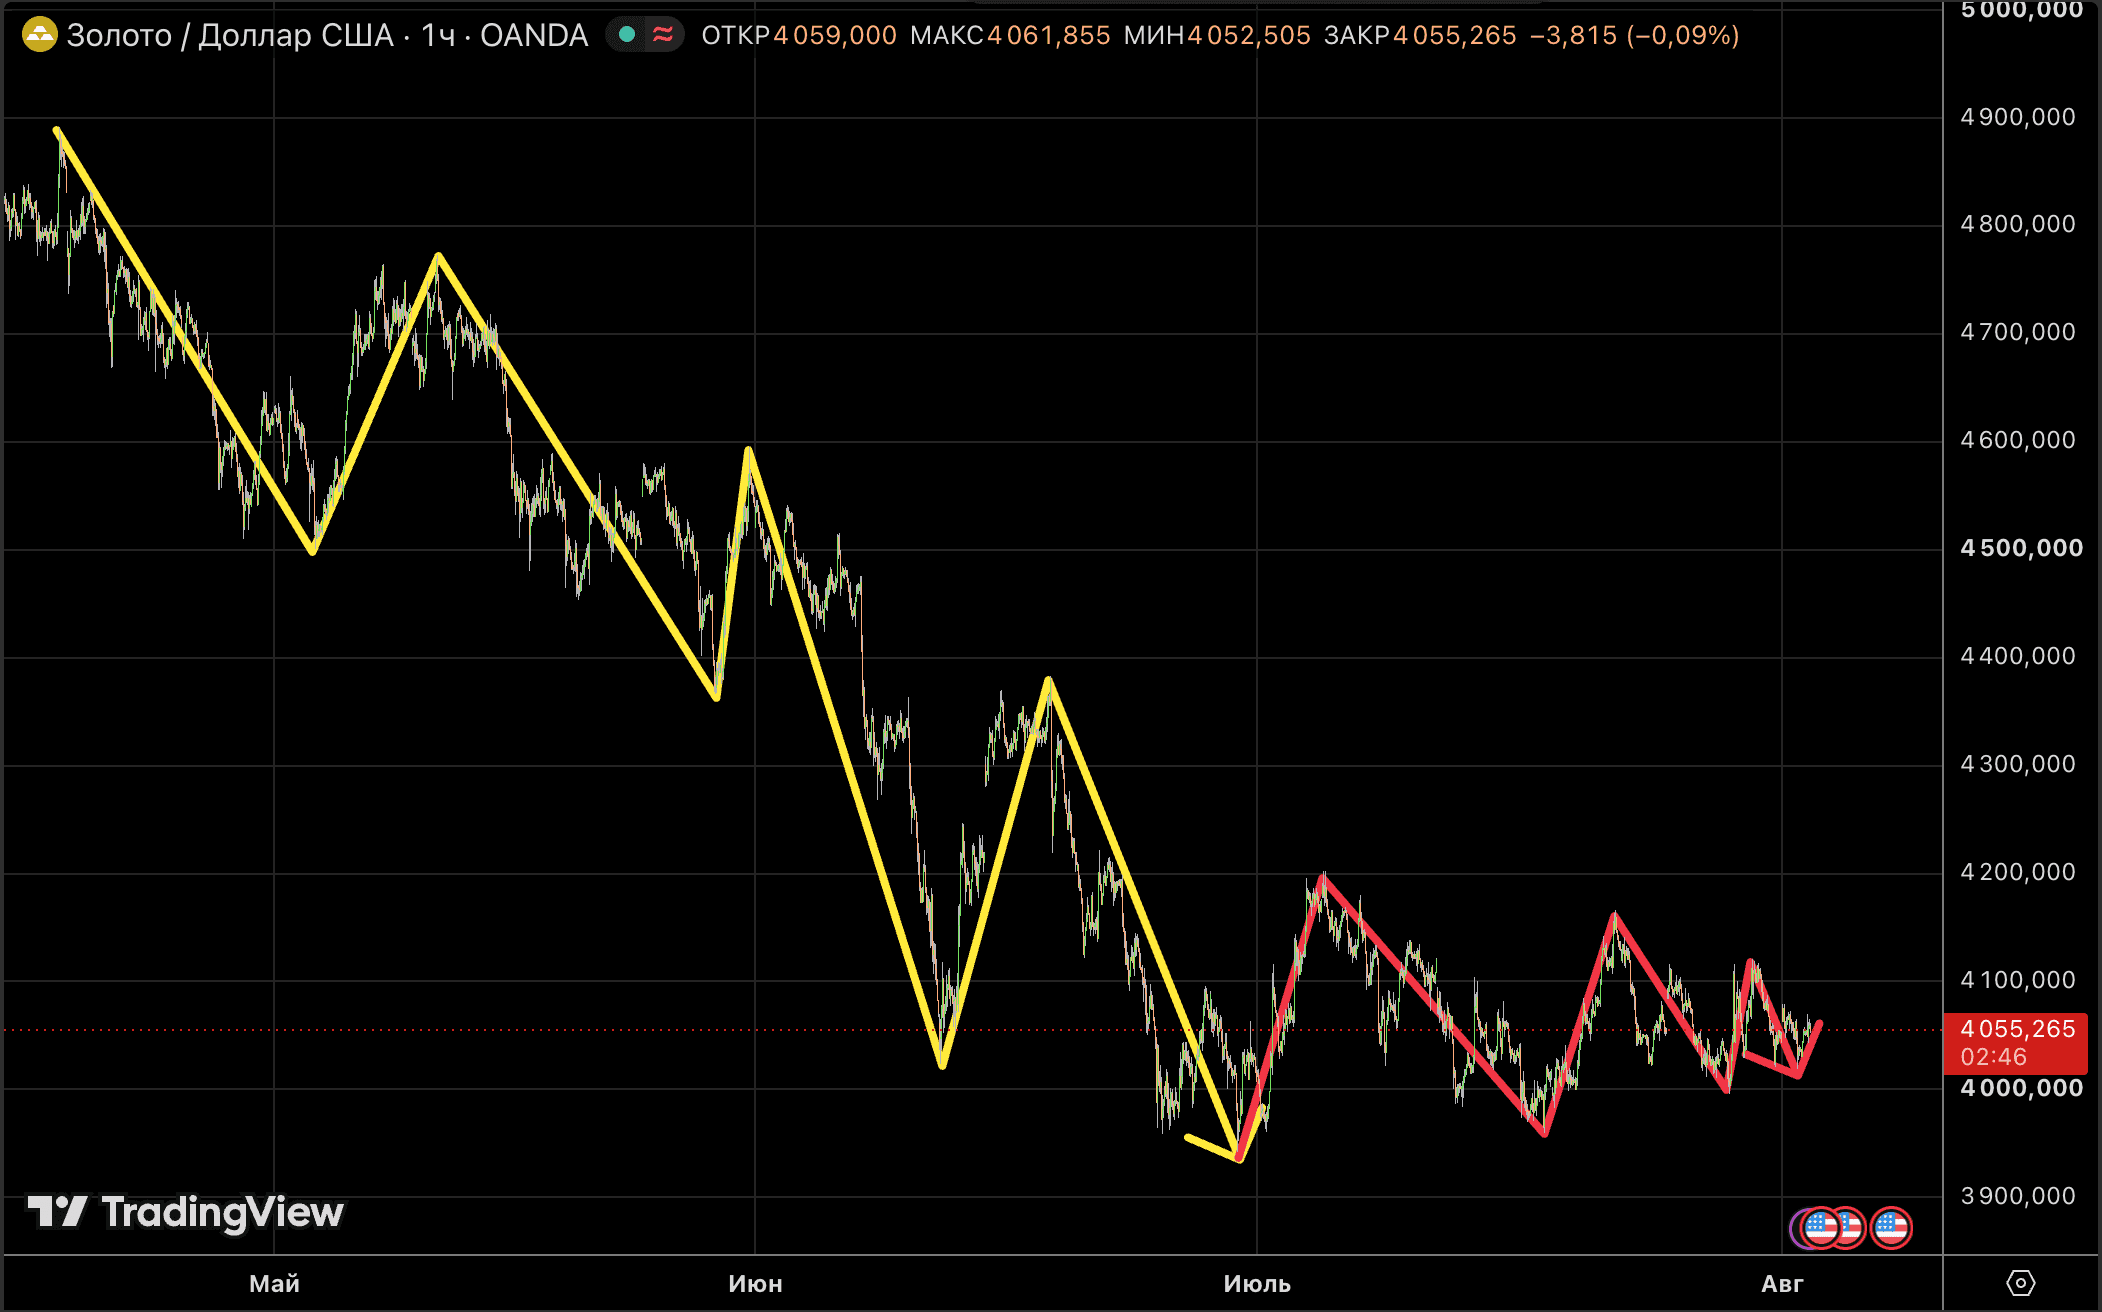 The Trend Has Stalled. But That Doesn't Mean It's ReversingMost traders try to spot a reversal long before it actually happens. In my opinion, this is one of the most common reasons traders lose money. The moment price starts slowing down, many immediately look for trades against the prevailing trend, even though the market hasn't provided any real evidence that the trend has ended.64
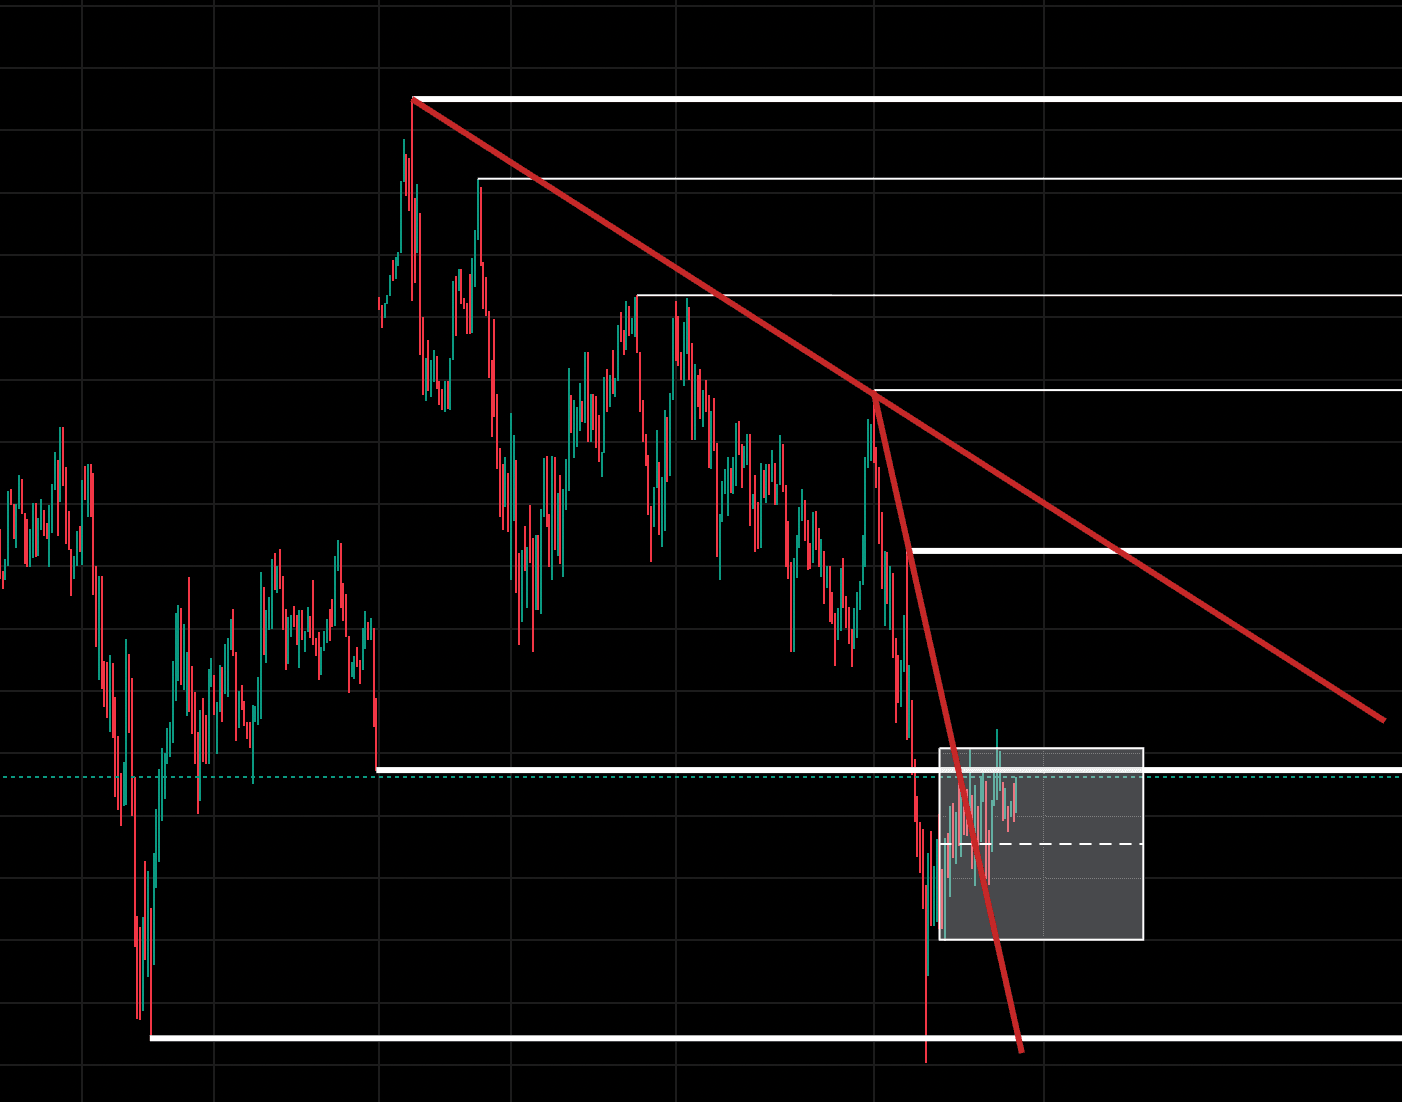 The Only 3 Tools You Need for Technical and Market Structure AnalysisMany new traders believe they need dozens of indicators, colorful lines, and complicated tools to analyze the market. Before long, their charts look like Christmas trees, overloaded with information that only creates confusion.50
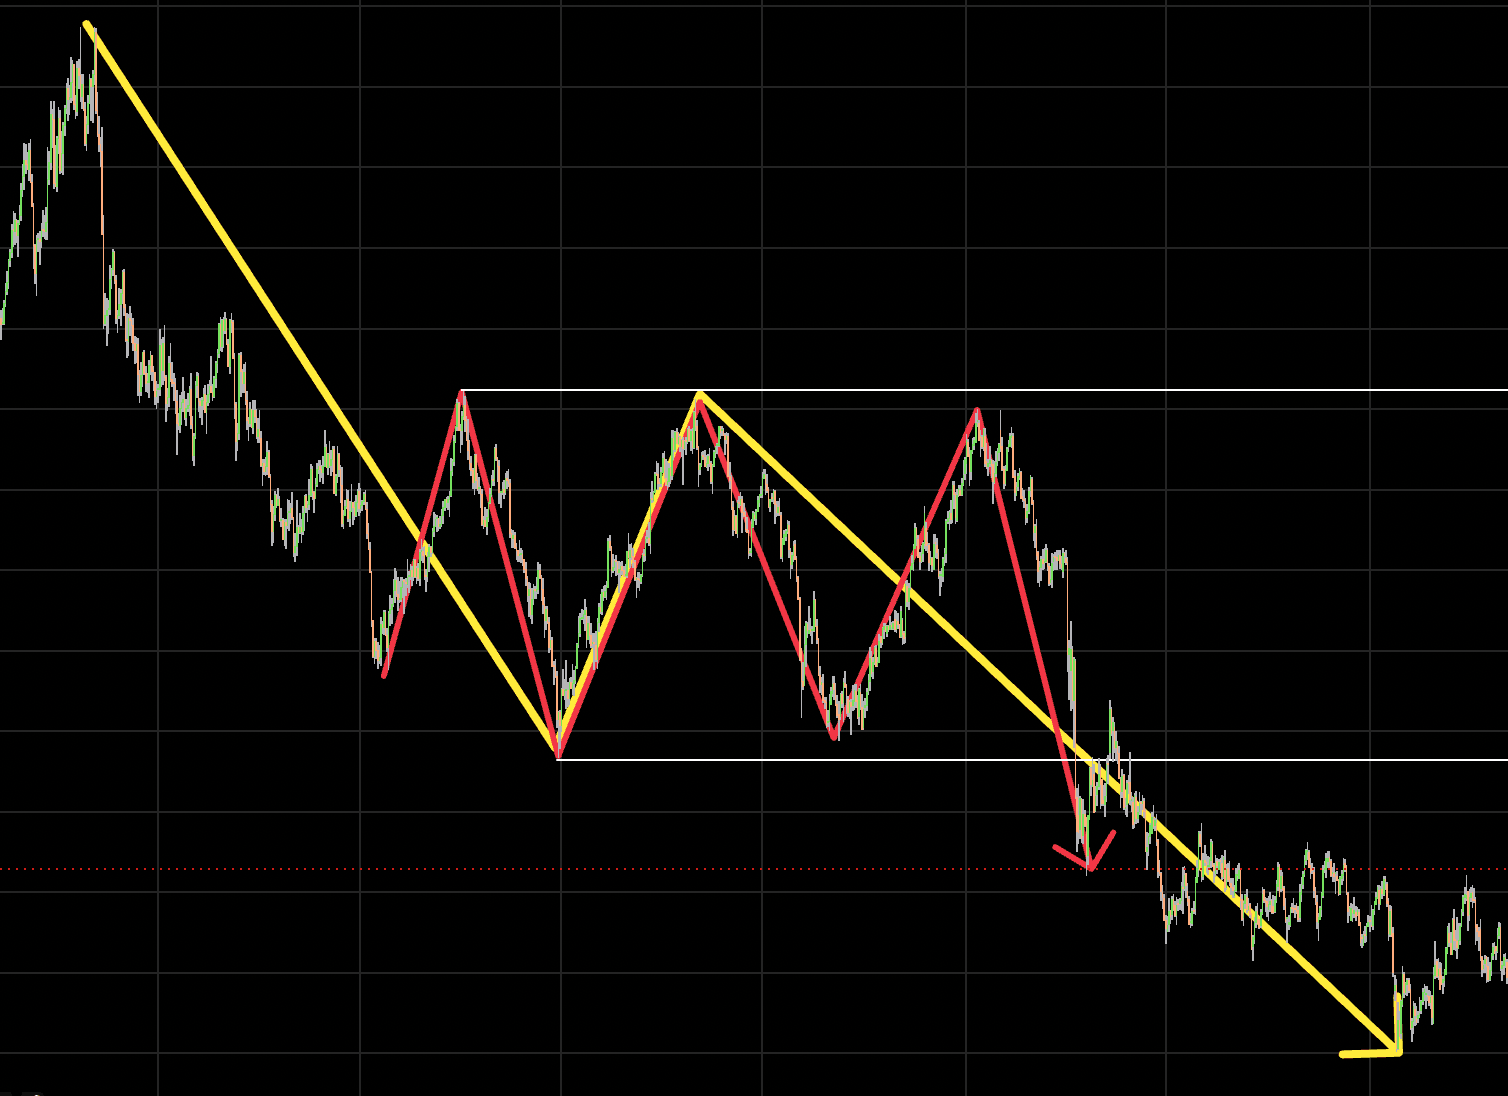 The accumulation phase — the most important element of market analysis**Why most traders read accumulation wrong**63
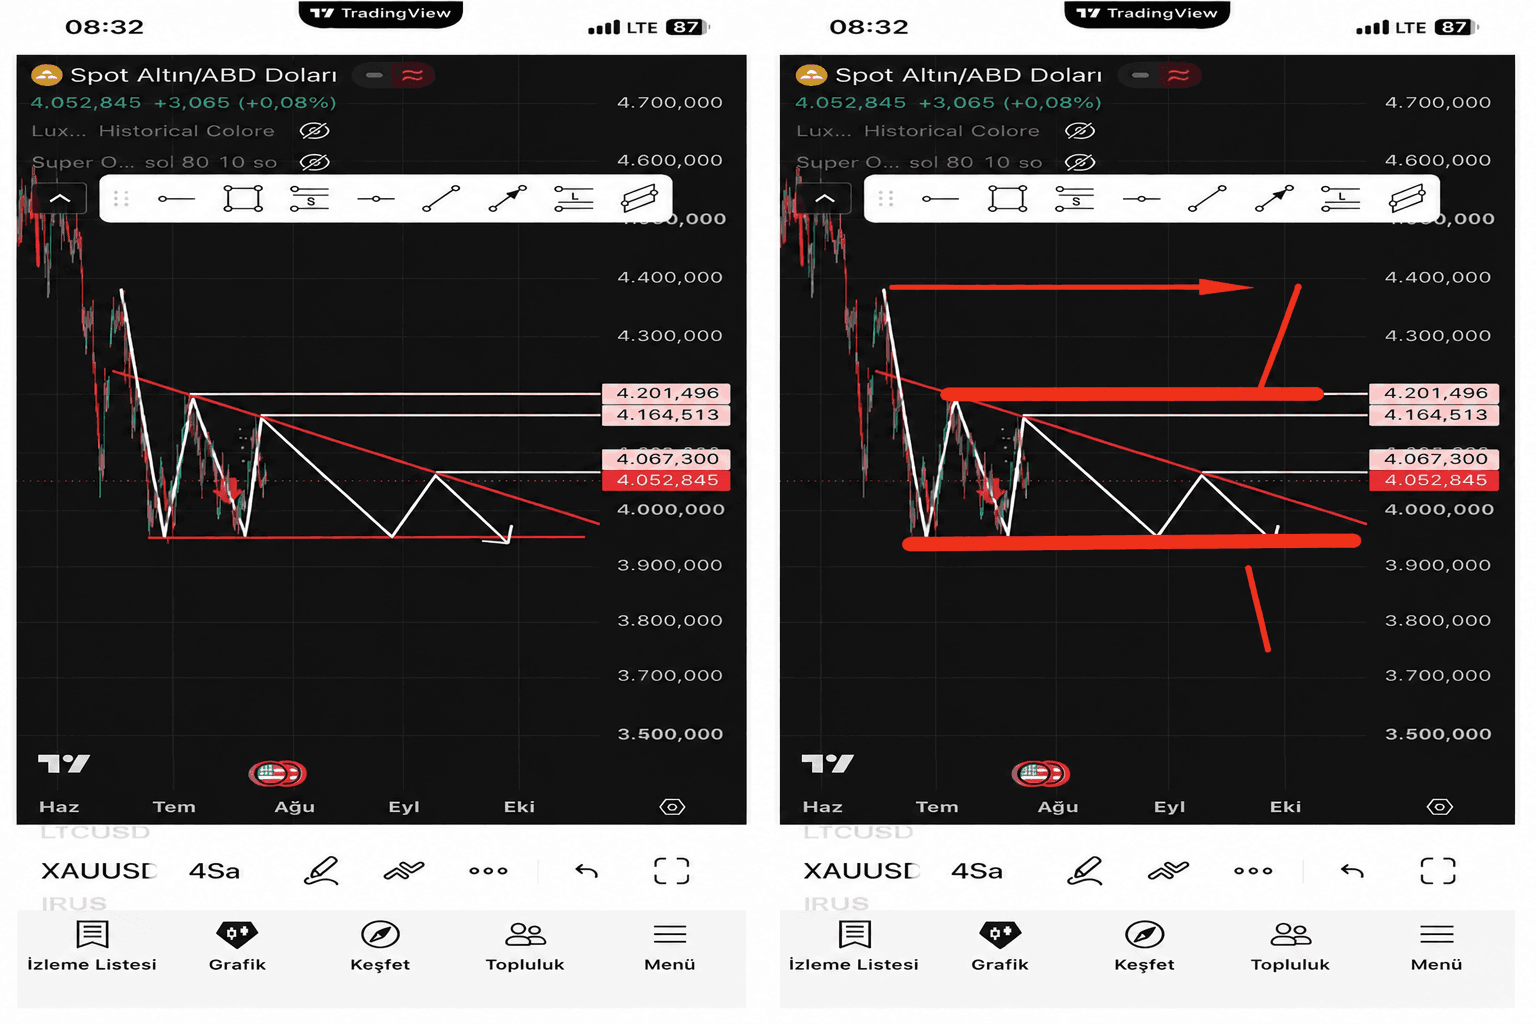 Seeing a pattern on the chart isn't enough. You need to know how to use it. Gold (XAUUSD)Colleagues, I want to raise an interesting topic for discussion, using gold (XAUUSD) as the example.30
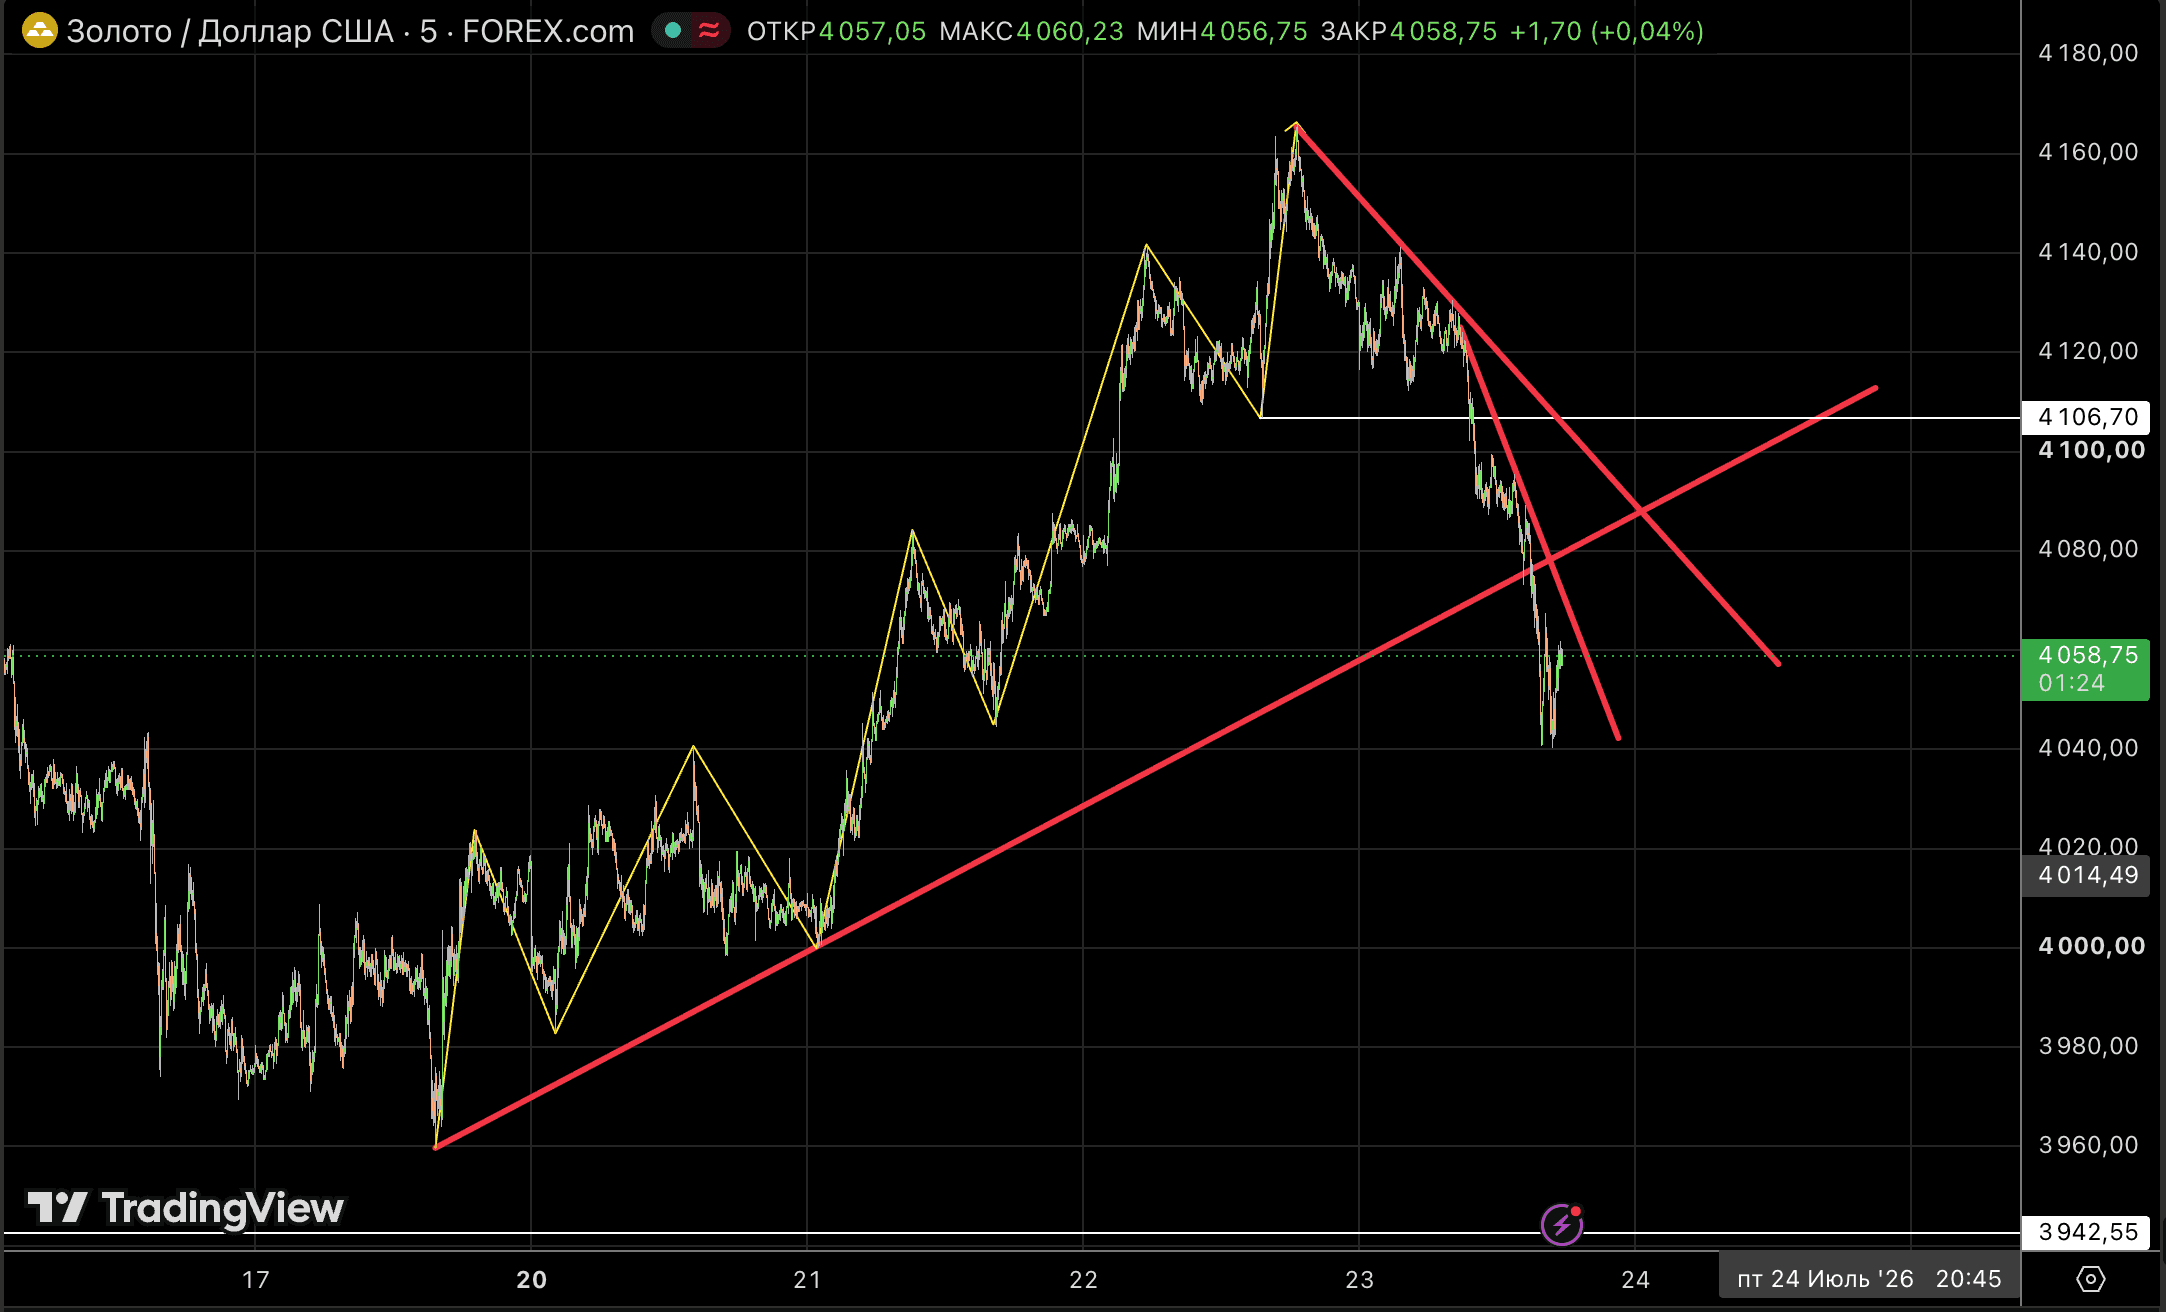 Gold (XAUUSD). Reading the current situation with trend lines 📉One of the most effective ways to read a market is to analyse several trend lines built using the Sperandeo method. It lets you objectively work out which side holds the edge, and tell a correction apart from a genuine reversal.37
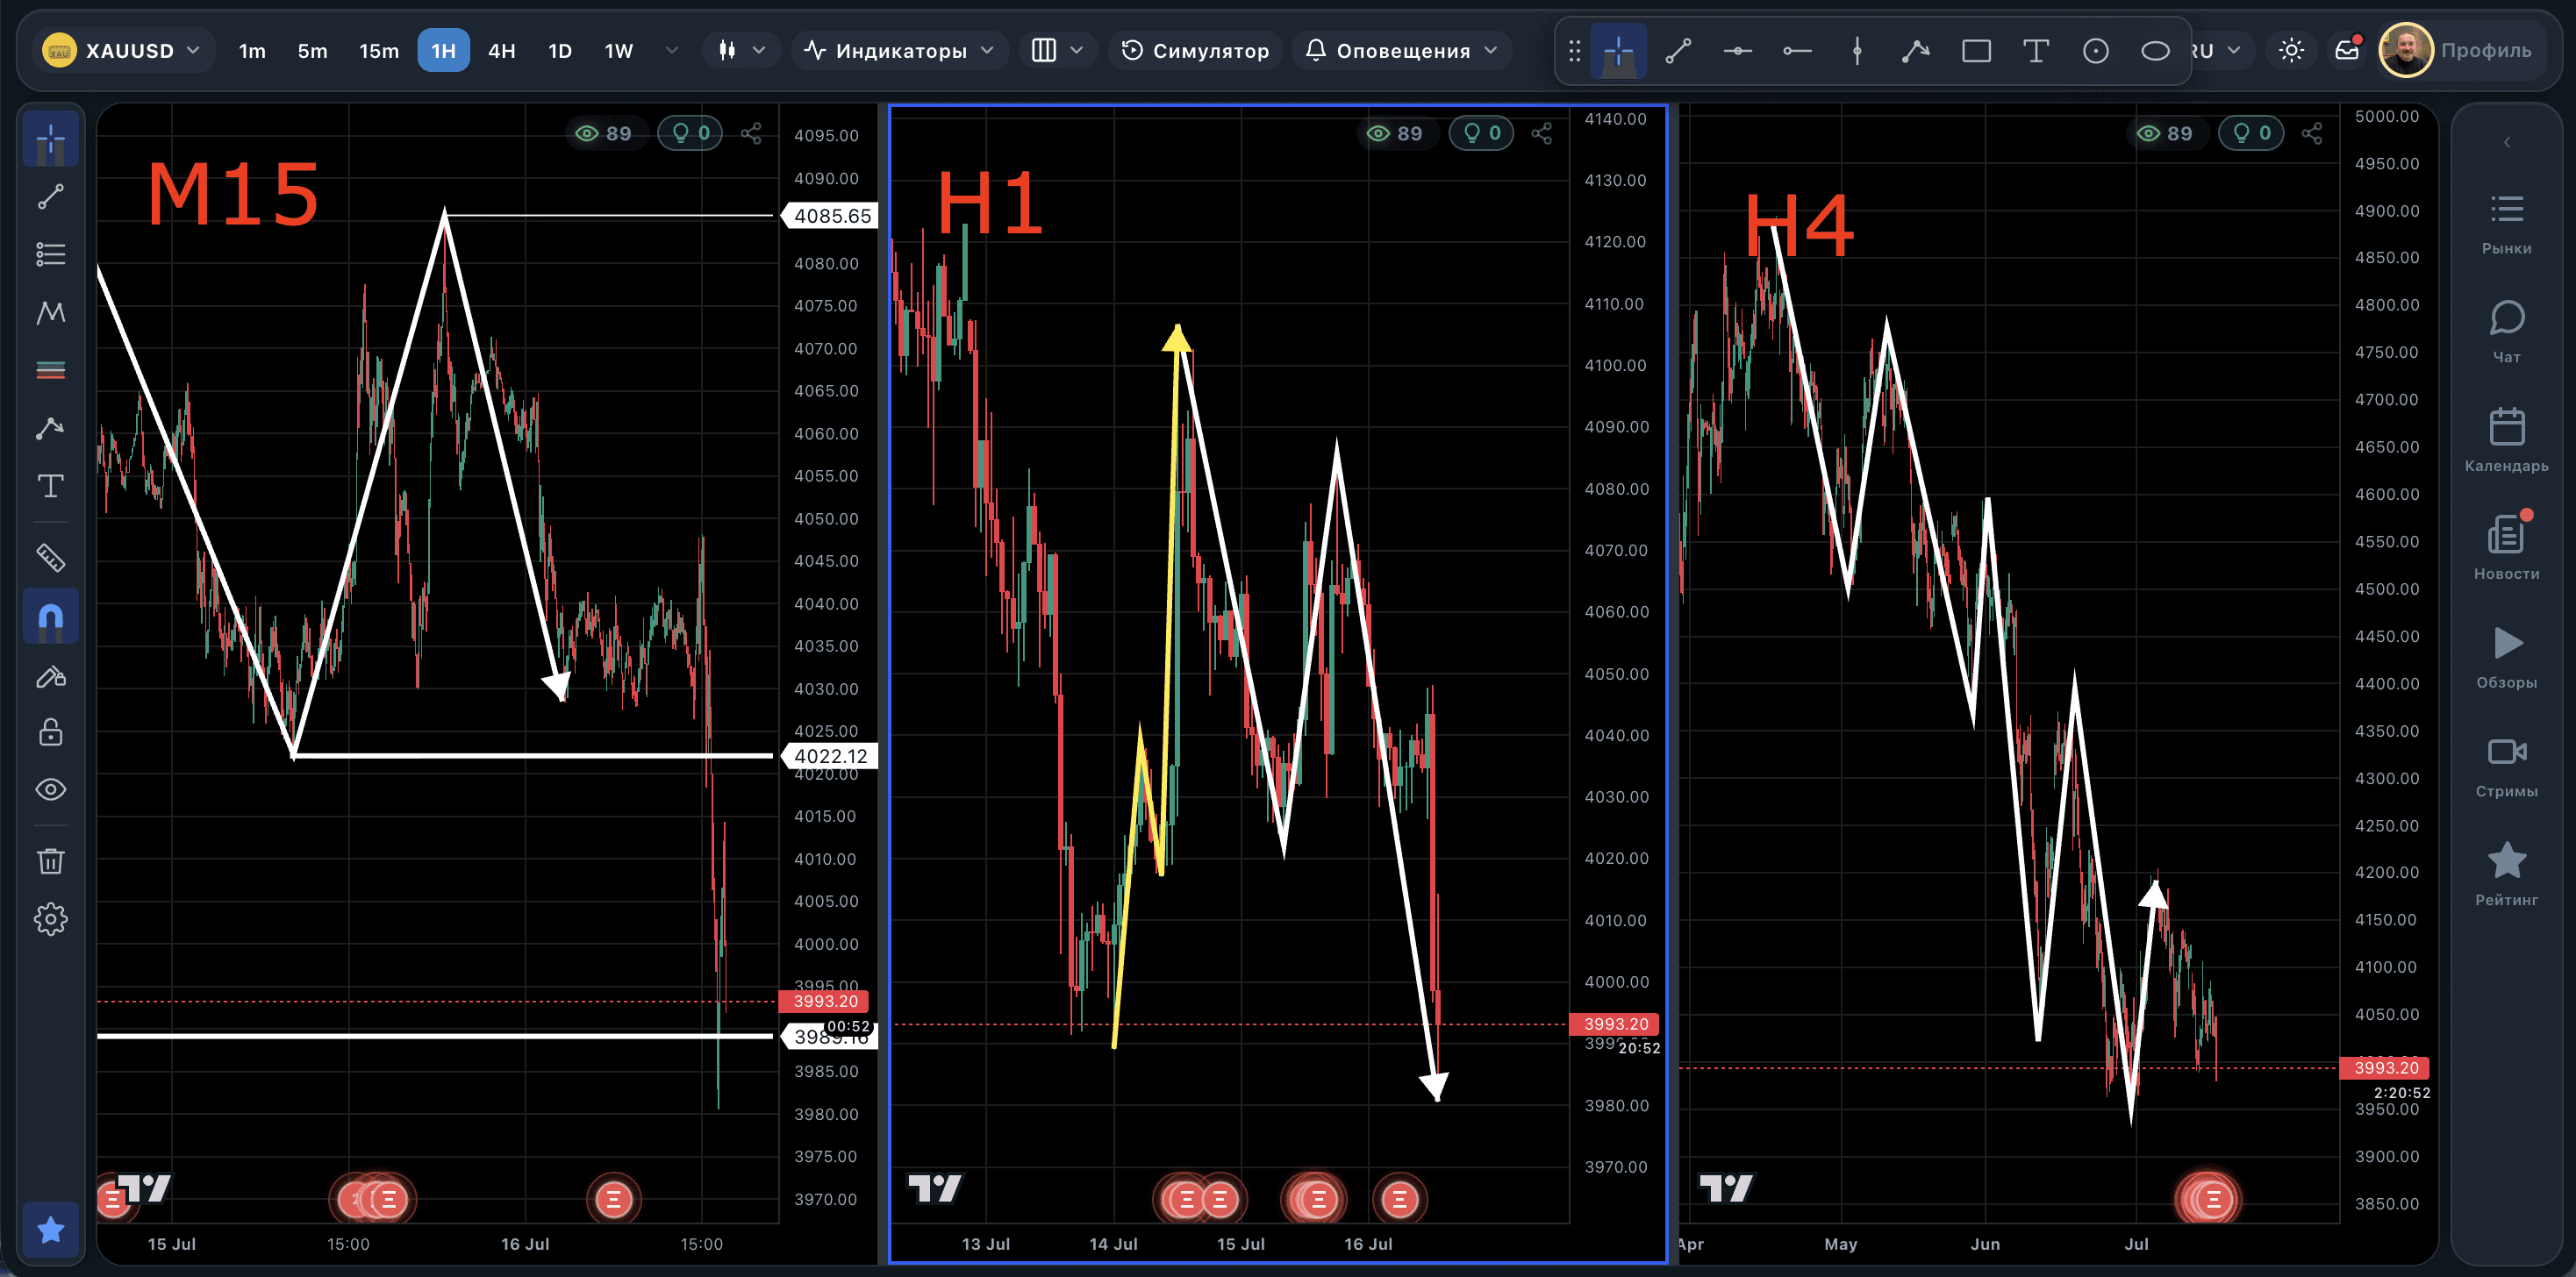 Elder's Triple Screen — how to analyse the market without cluttering your chart 📈Many traders run into the same problem. As the analysis goes on, levels, arrows, zones, labels and various notes pile up. After a while the workspace turns into a proper Christmas tree, where it is hard to see what actually matters.54
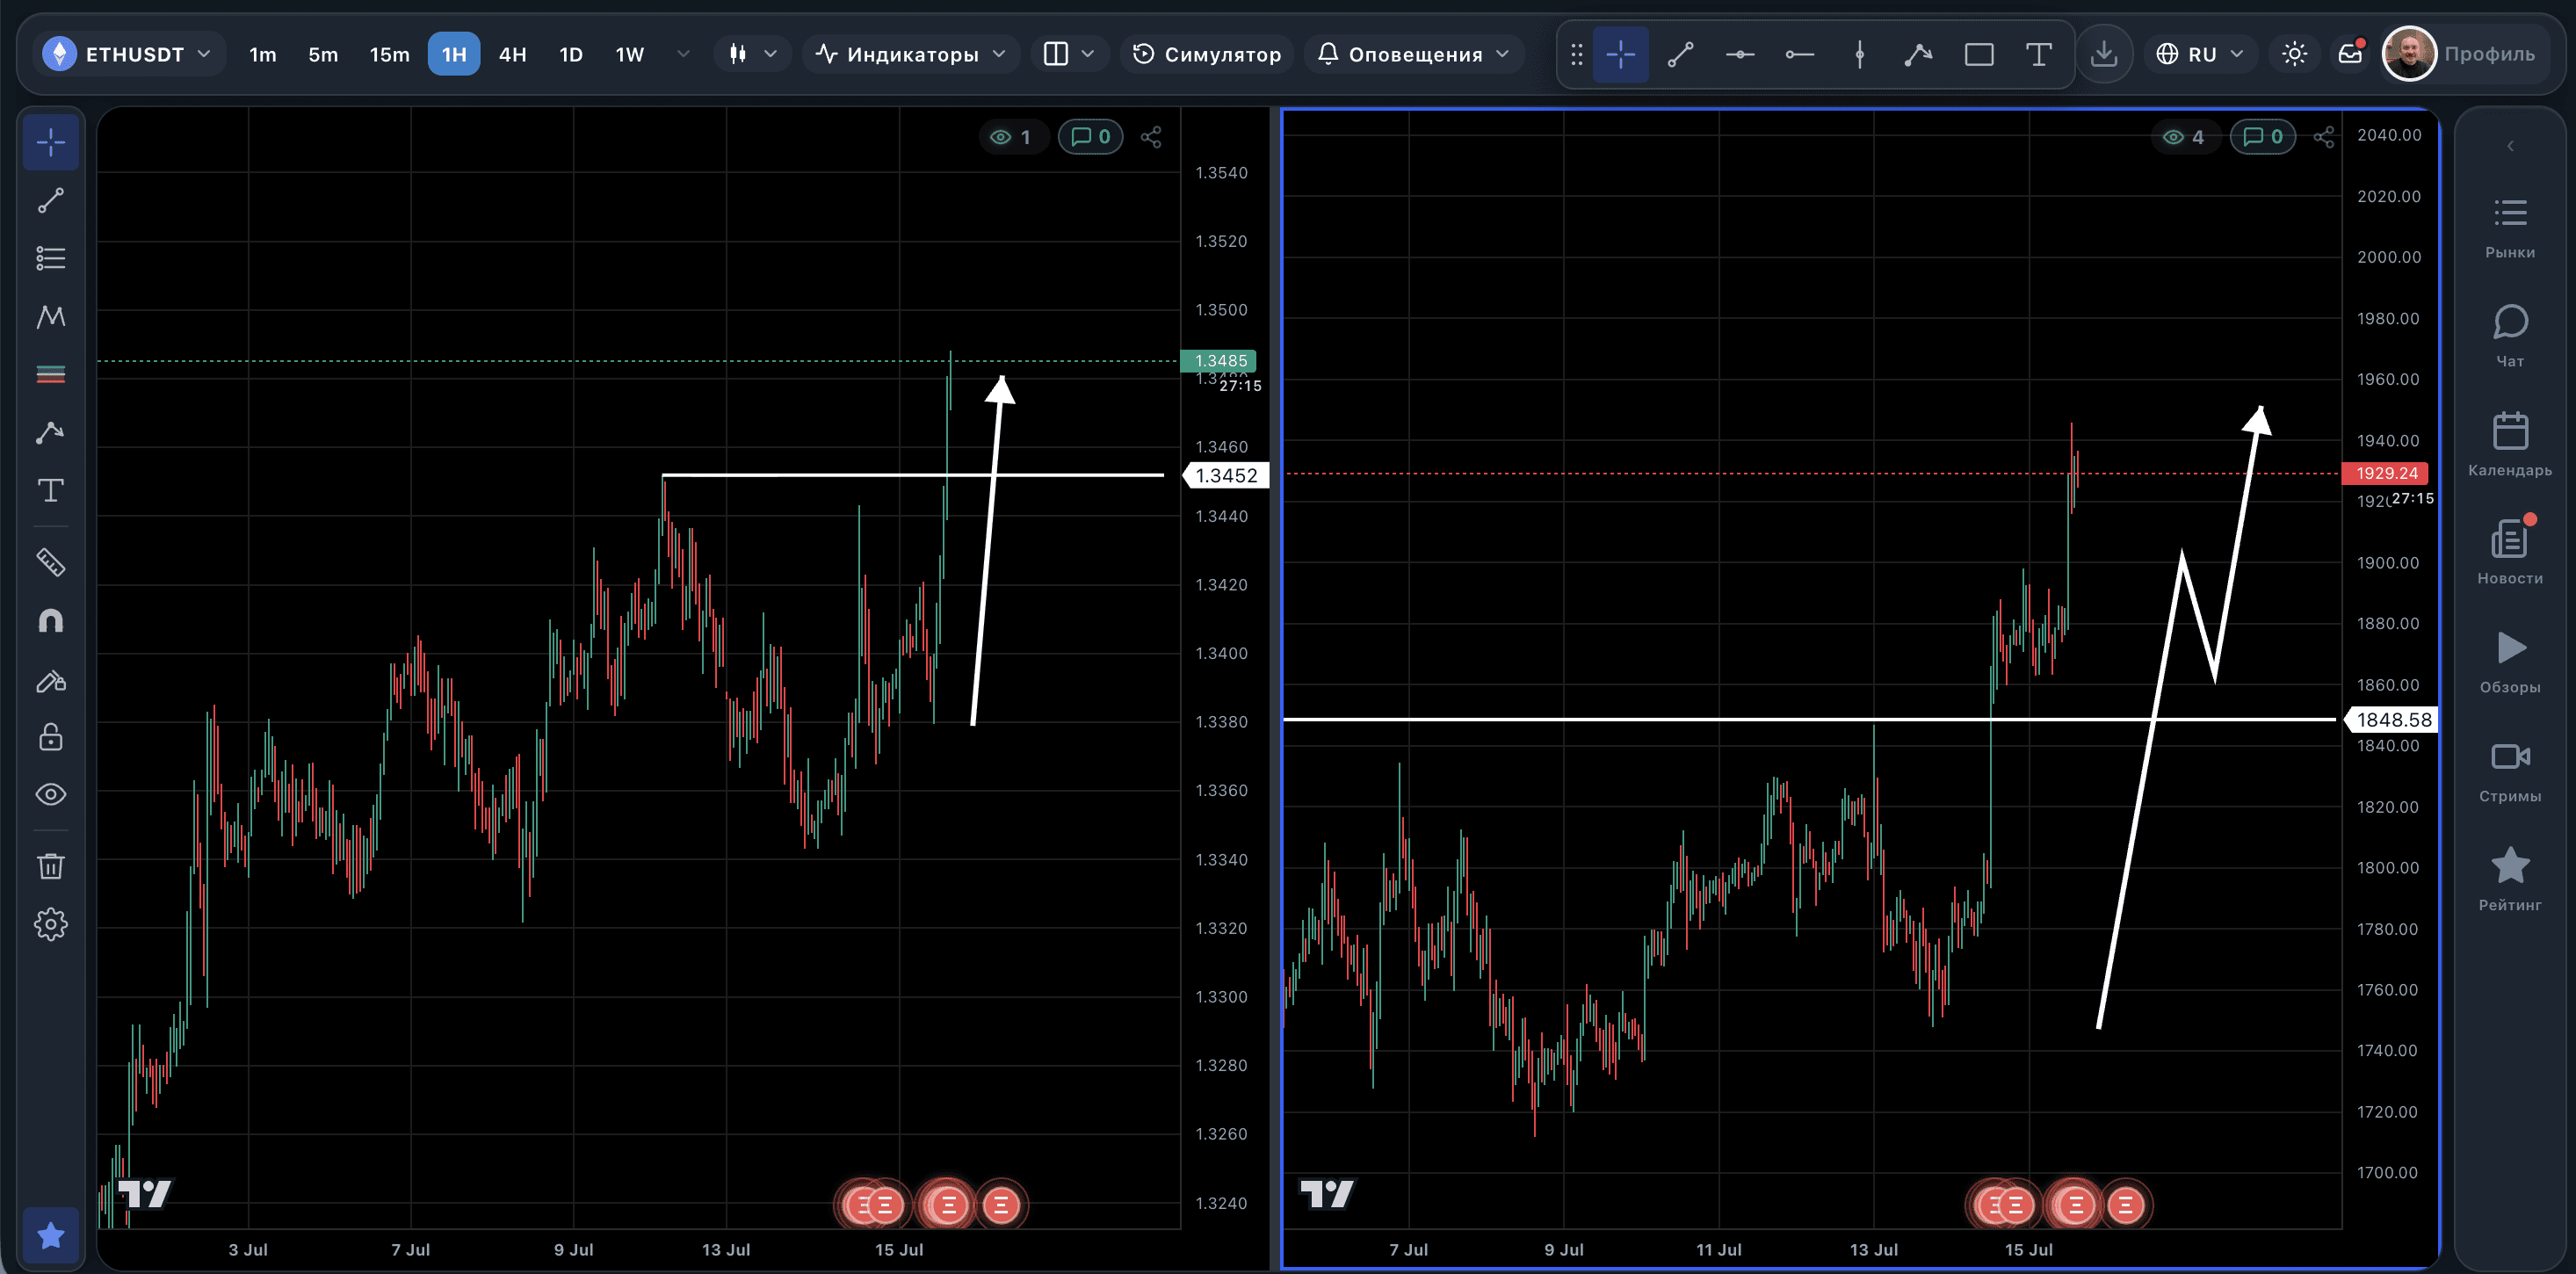 Why a candle closing beyond a level is not yet a confirmed break 🤔The subject of breaking a level has been argued over for years. Open any technical analysis textbook or watch a few training videos and you will almost certainly hear the same rule: if a candle closed beyond support or resistance, the break is confirmed.40
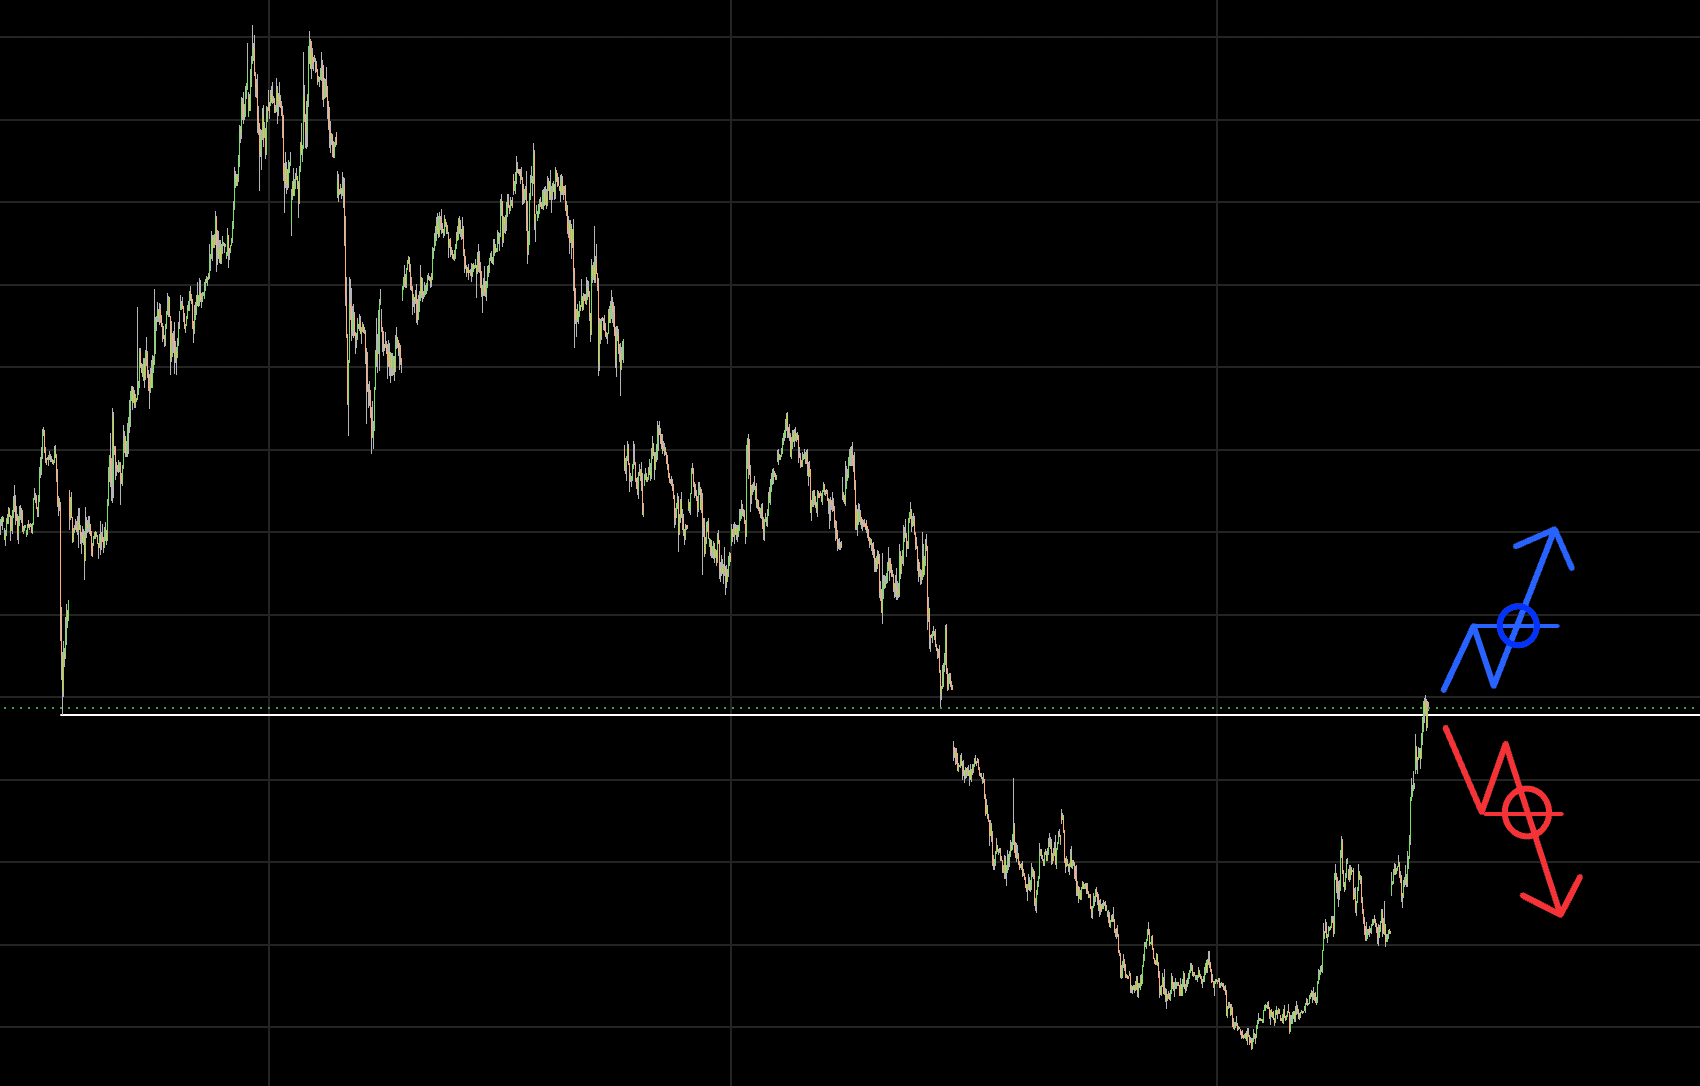 Trading from a level — what it is and how to do it properlyYou have surely heard the phrase "trading from a level" more than once. It sounds simple, but when it comes to an actual trade the questions start piling up. Enter straight away? Wait for a break? Or look for a reversal instead?63
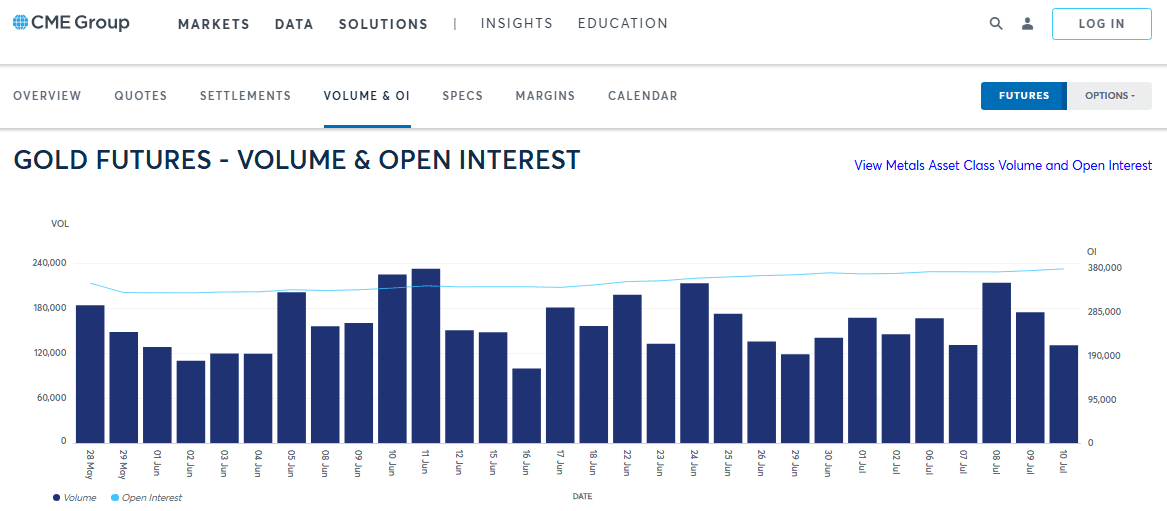 How to read the Volume and Open Interest chart on the CMEMany traders regularly visit the Chicago Mercantile Exchange (CME) website and open the Volume & Open Interest section. That is exactly the chart you can see in the image above.66
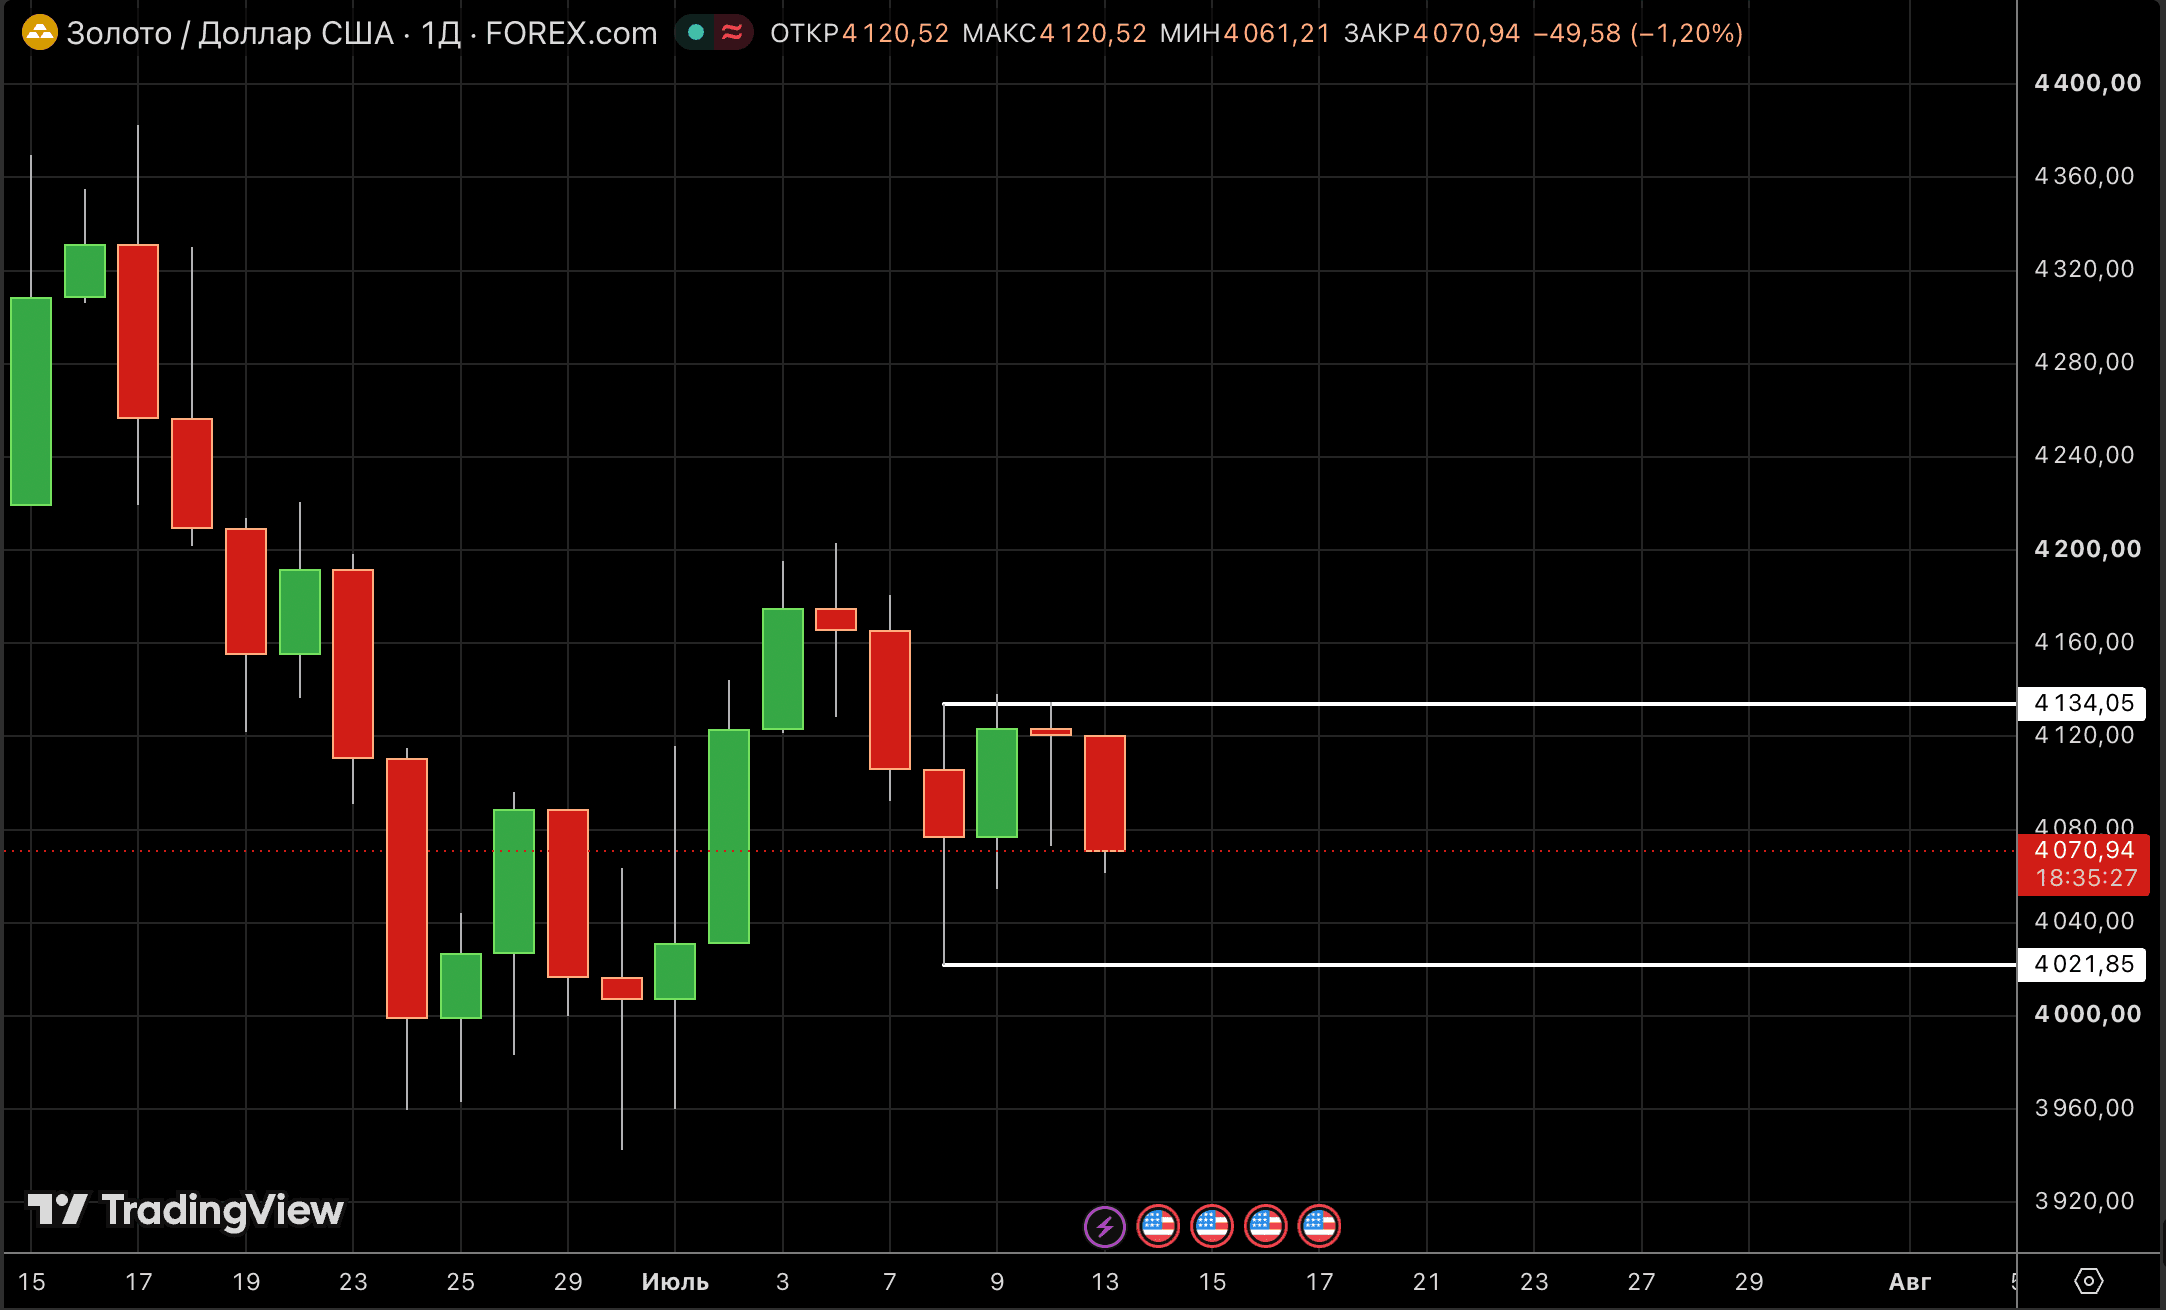 Gold (XAU/USD): a fourth day of accumulation before the next move**Gold has now spent four days in accumulation**42
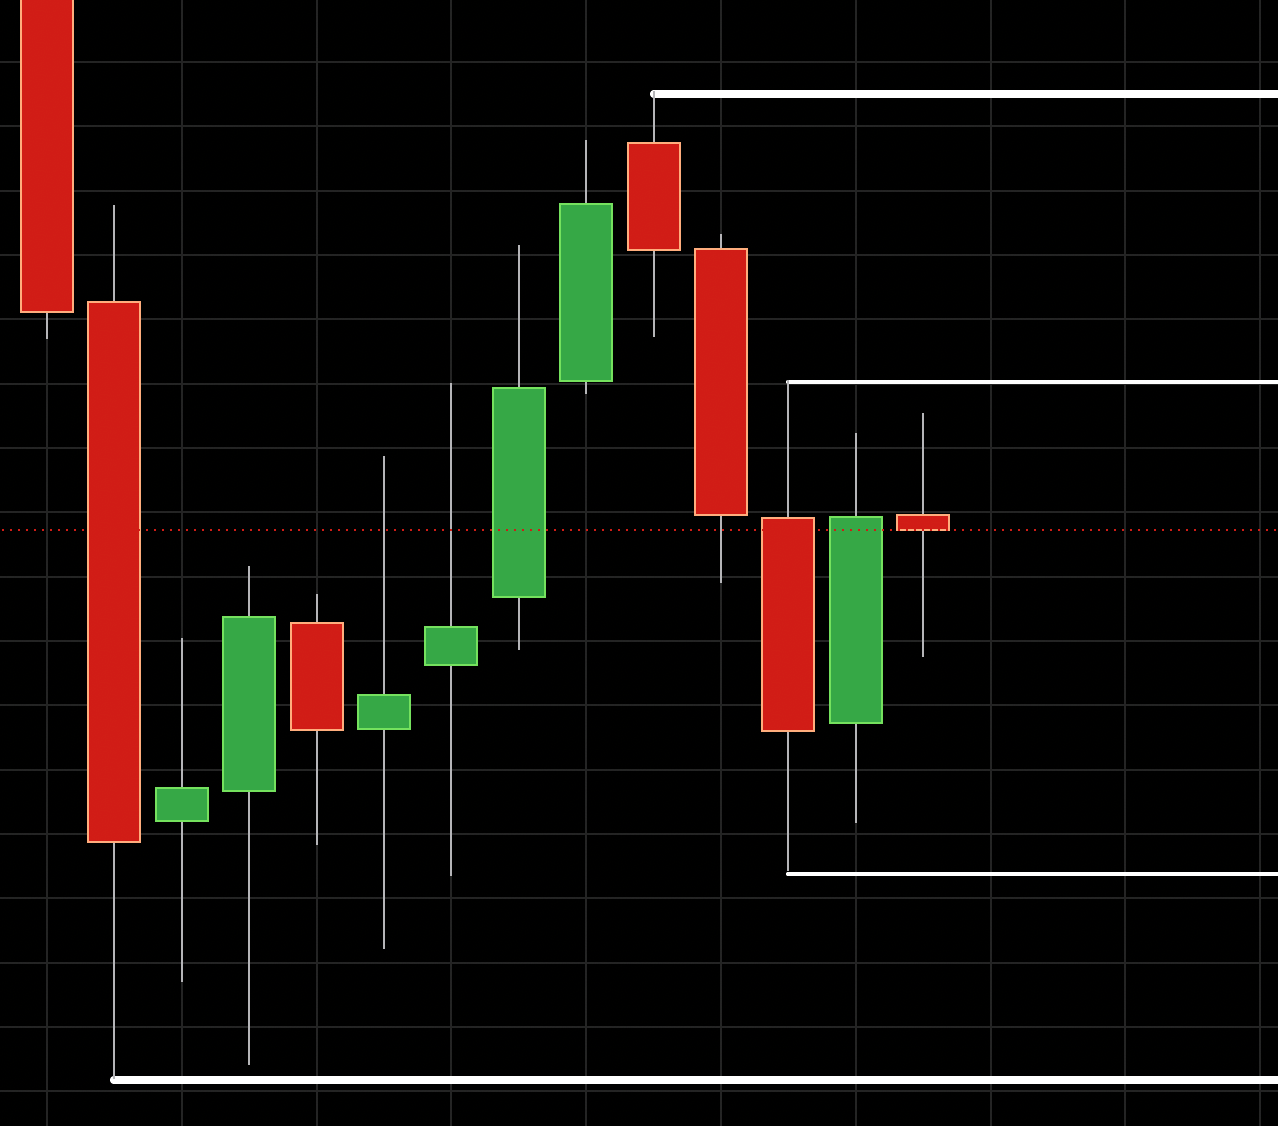 How to identify accumulation and the targets for price after the breakTrading in the accumulation phase is considered one of the hardest tasks for most traders. Price moves in a range, false breaks happen regularly, and the direction of the next impulse is unknown in advance. Yet there is a fairly simple way to define the boundaries of an accumulation, prepare your scenarios ahead of time and know where the most likely targets will be once price leaves48
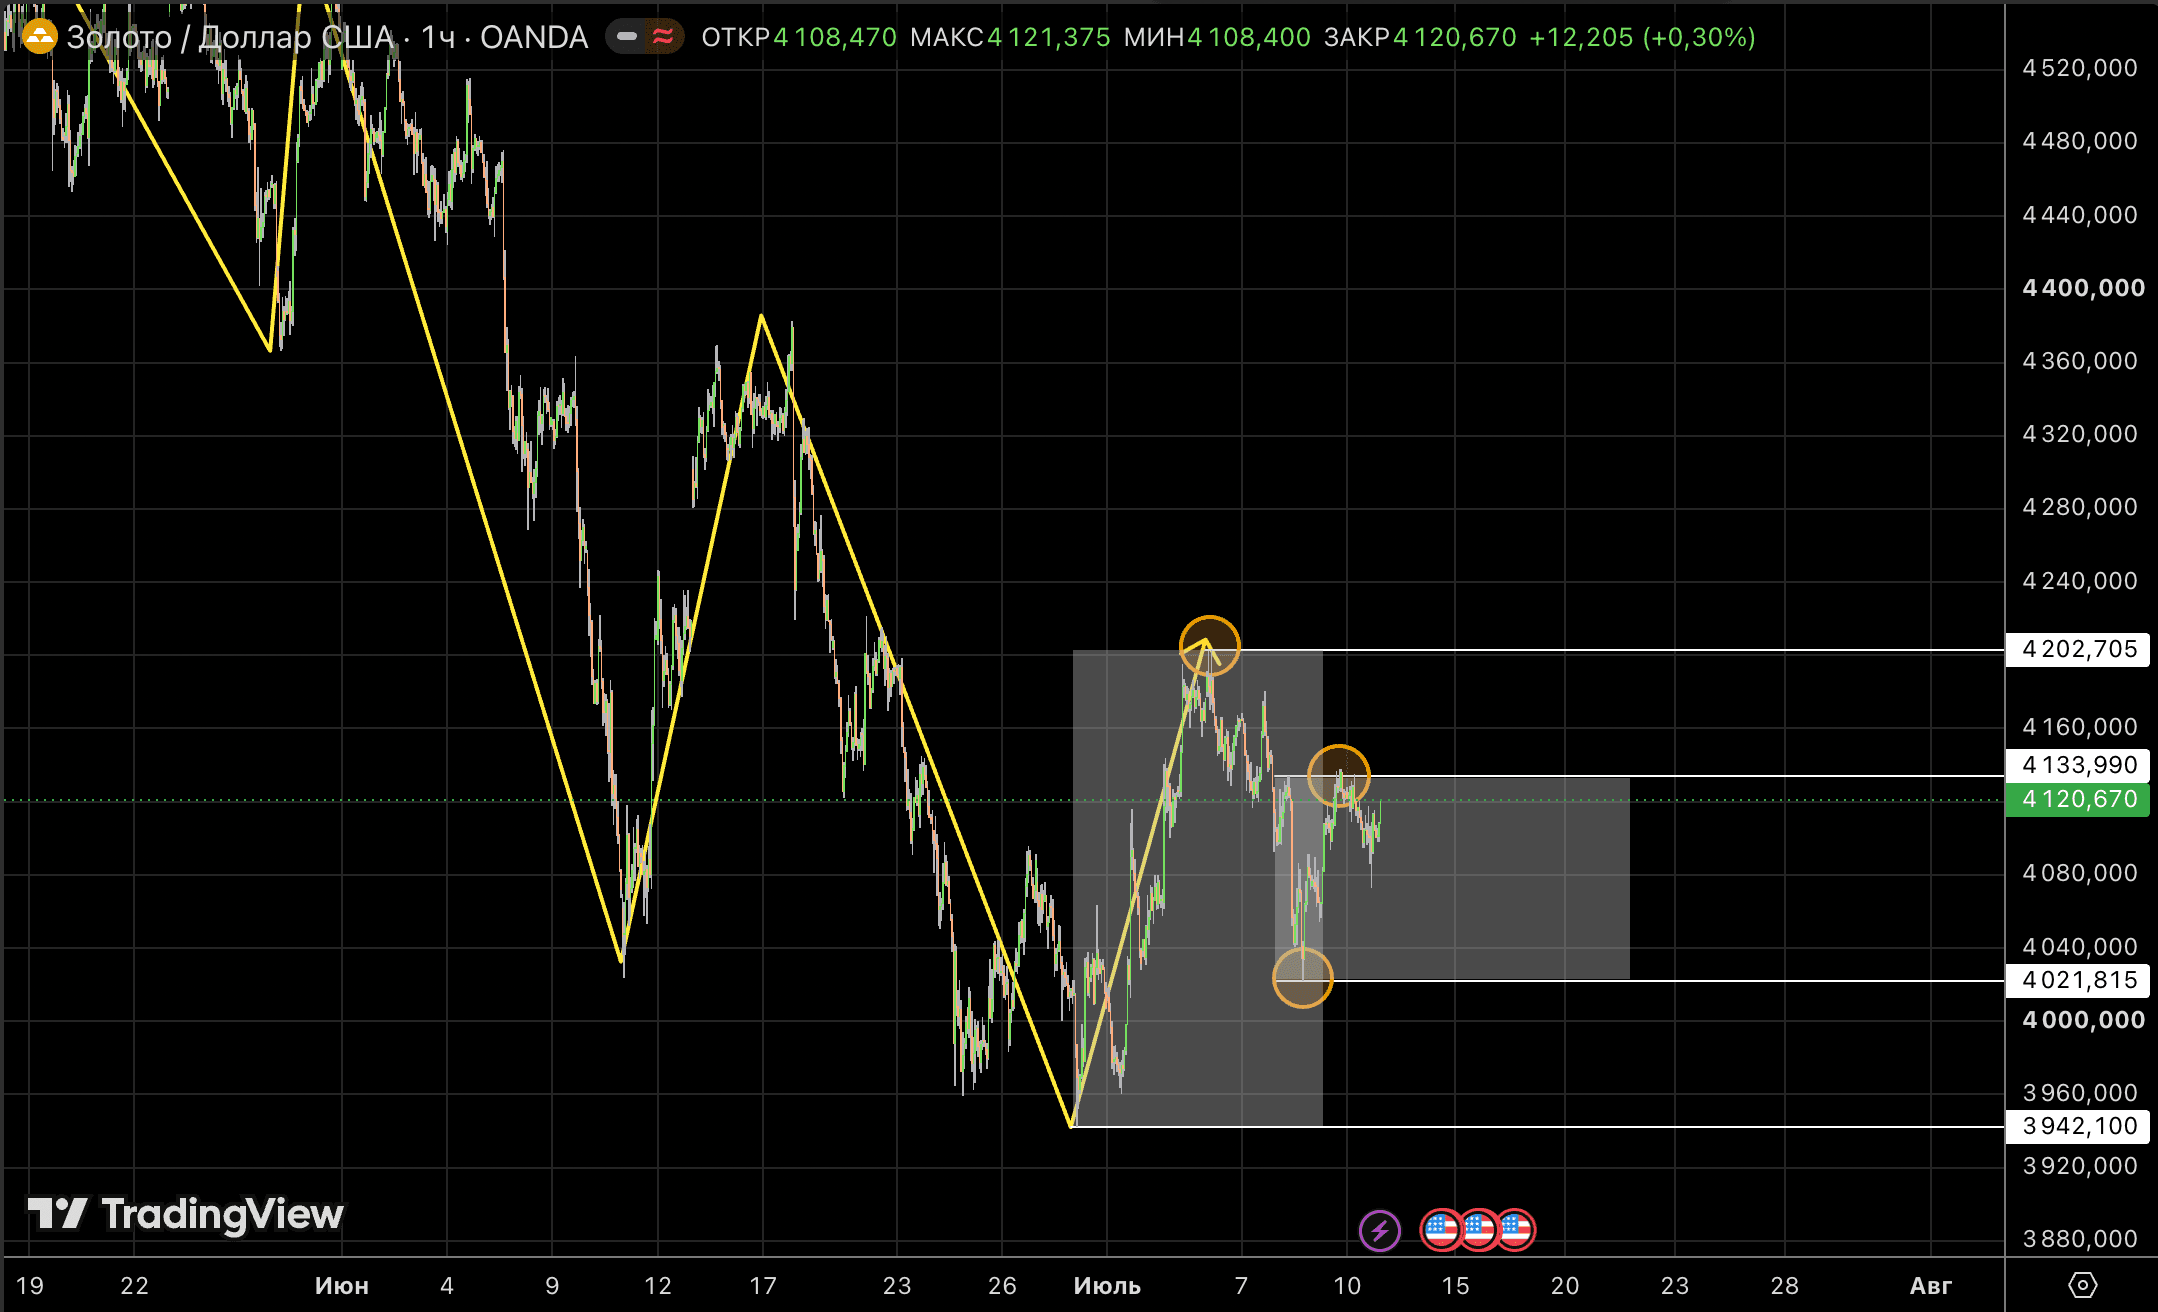 Last trading week, 6–10 July, in Gold (XAUUSD): the market stalled between two key rangesThe past trading week in gold turned out to be quite interesting in terms of market structure. Even though participants managed to break the previous upward corrective move completely, we still haven't seen the main medium- and long-term downtrend resume.44
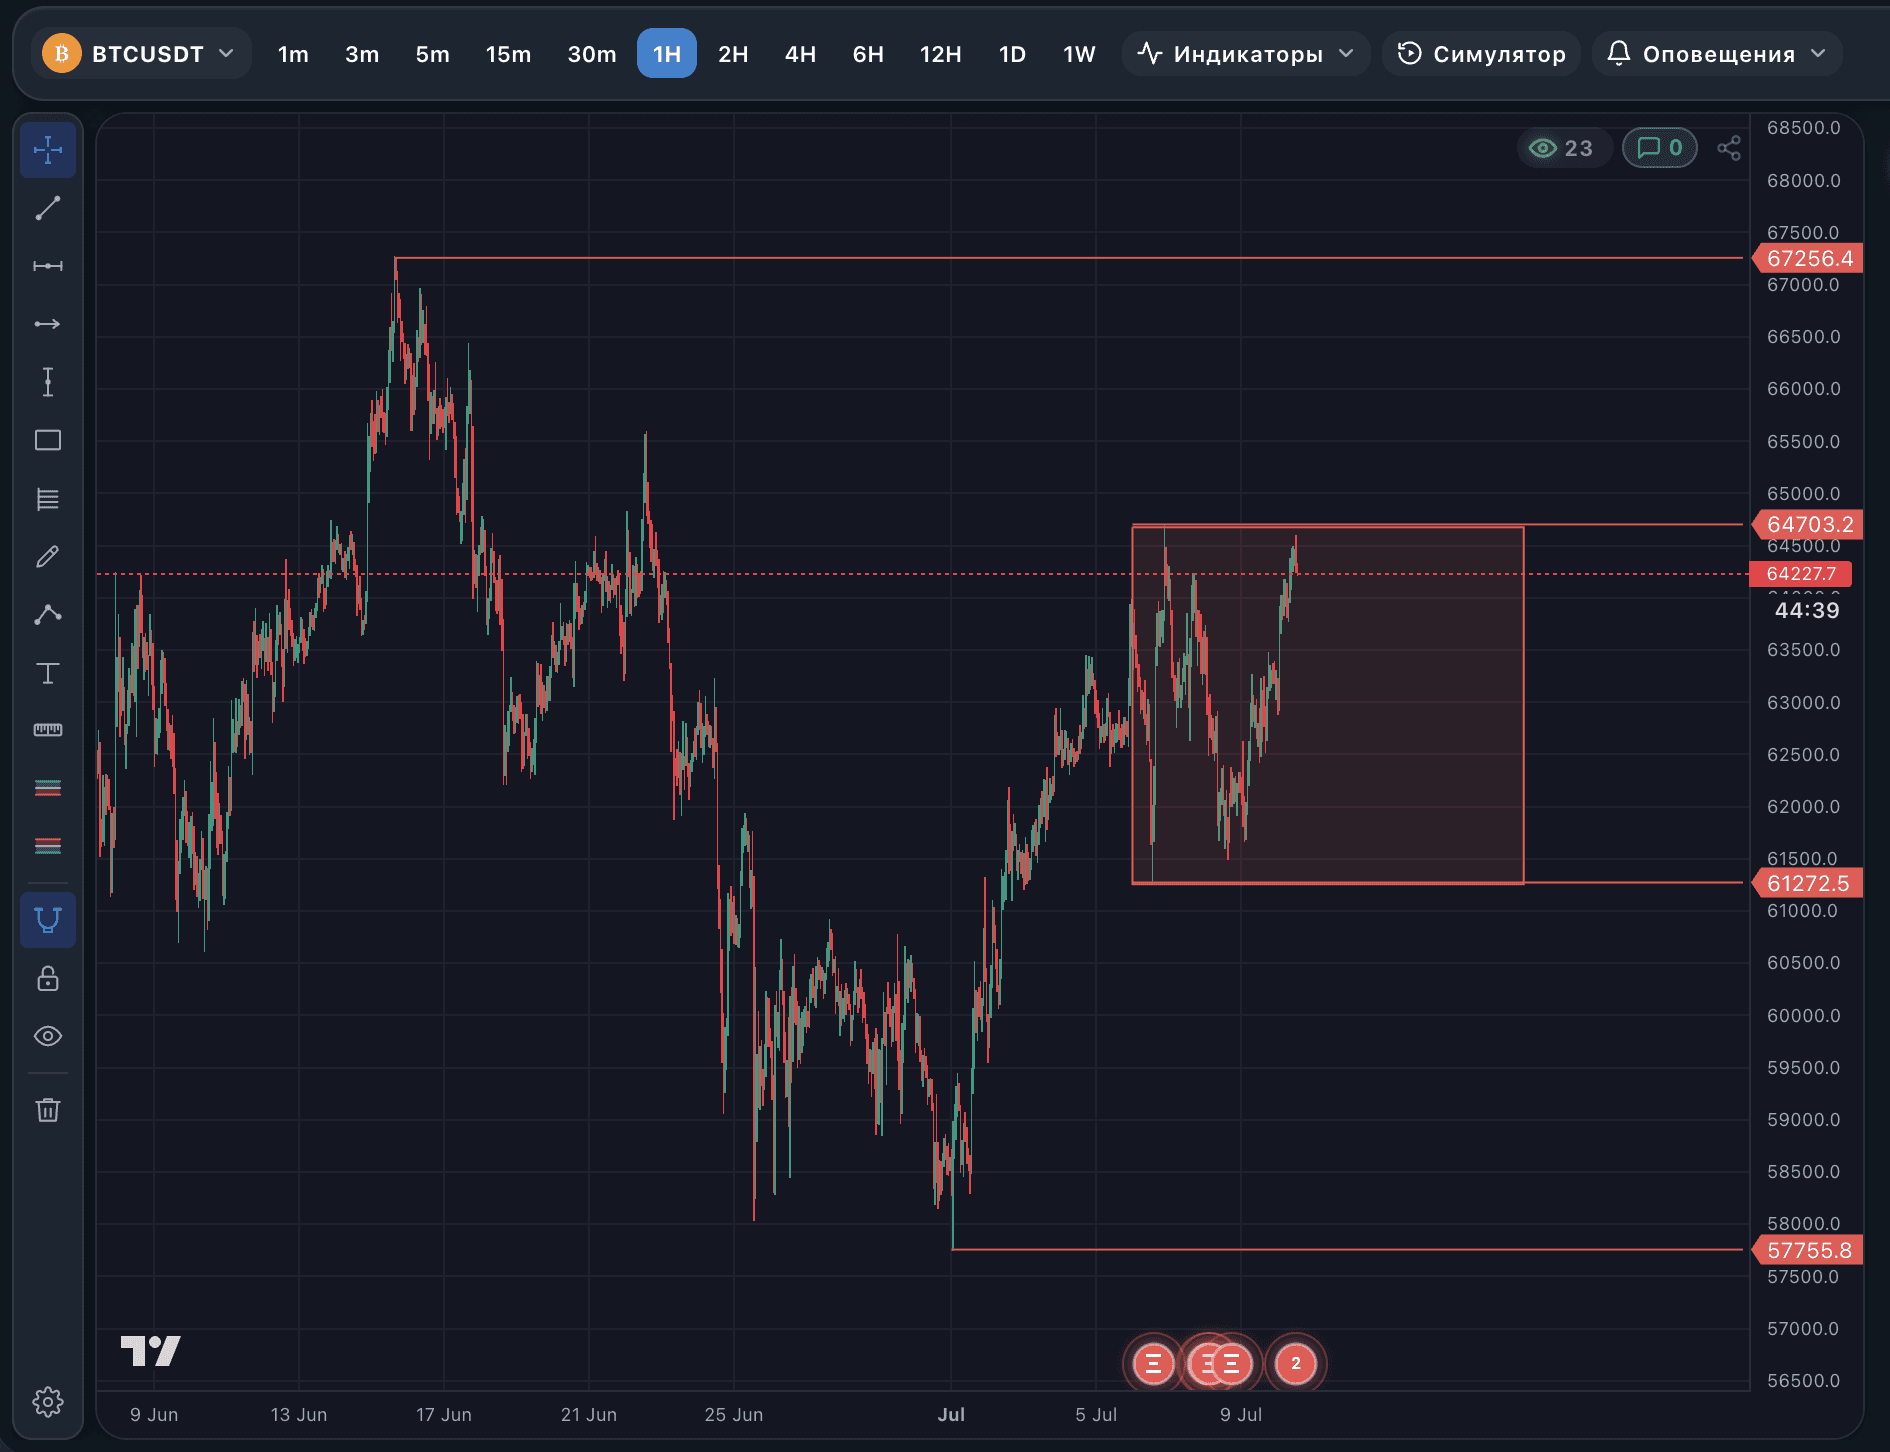 Bitcoin (BTC), H1 timeframe: accumulation continues. Which scenarios are most interesting now?On the hourly Bitcoin chart the situation is practically unchanged. Price is still inside a wide accumulation range, which means market participants are not yet ready to decide on direction.29
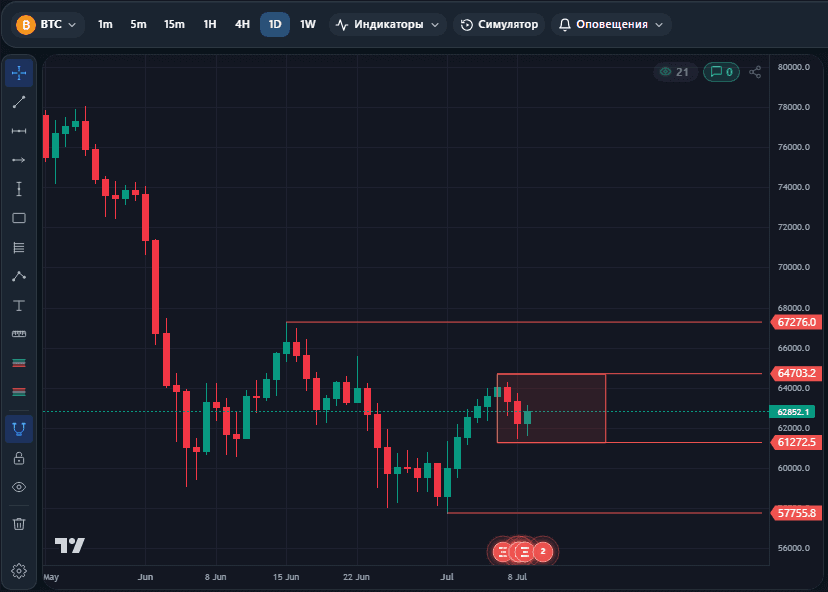 Bitcoin (BTC): the key range on H4 and D1. Which way will price break?Bitcoin (BTC) is putting together an interesting technical picture right now. Seen through the H4 and D1 timeframes, the market has been in wait-and-see mode for several days.39