The trading terminal traders share
One site instead of a dozen tabs: charts with drawing tools, footprint, a replay simulator, paper trading, news, an economic calendar, market breakdowns, an academy and a live chat. All free.
Free · no card · sign in with Google or Telegram · runs in the browser
- 4 142
- traders with us
- 47
- instruments
- 50
- market breakdowns
- 0$
- cost of access
A live chart on our own engine. The data is historical — this shows how the tools work, not current quotes.
What it looks like inside
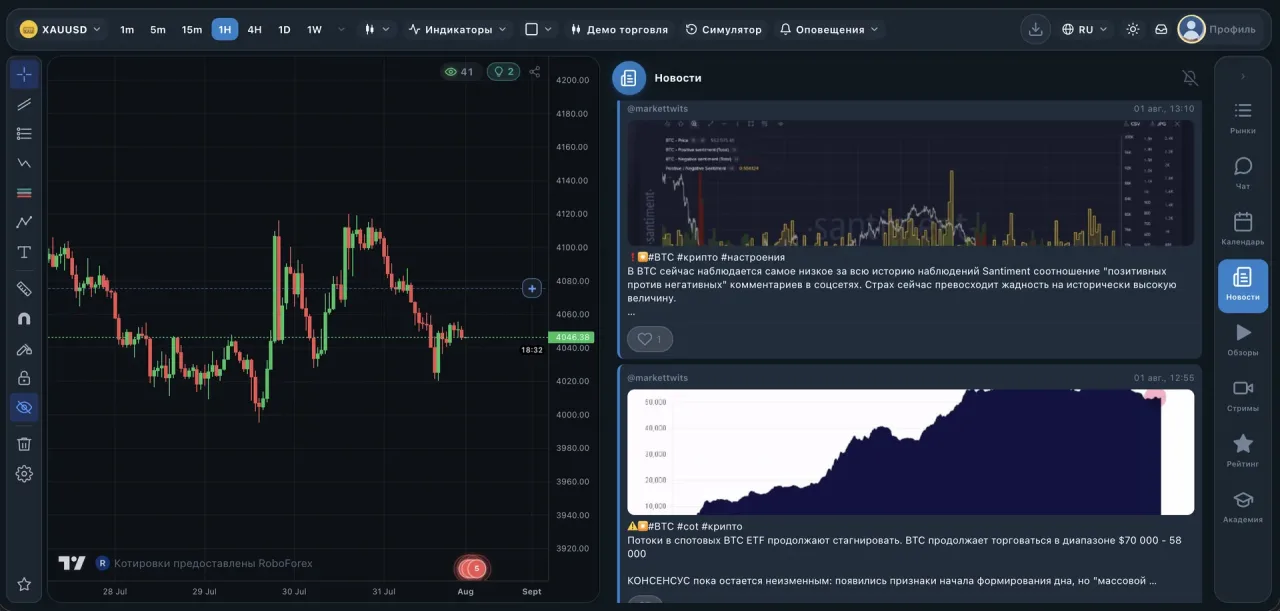
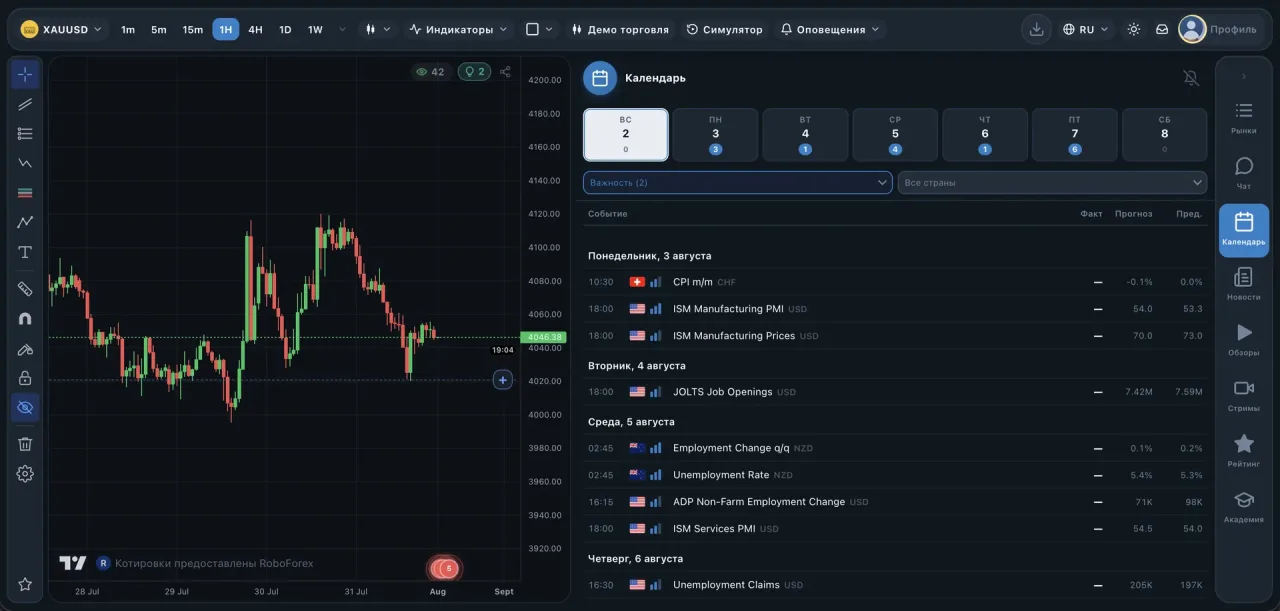
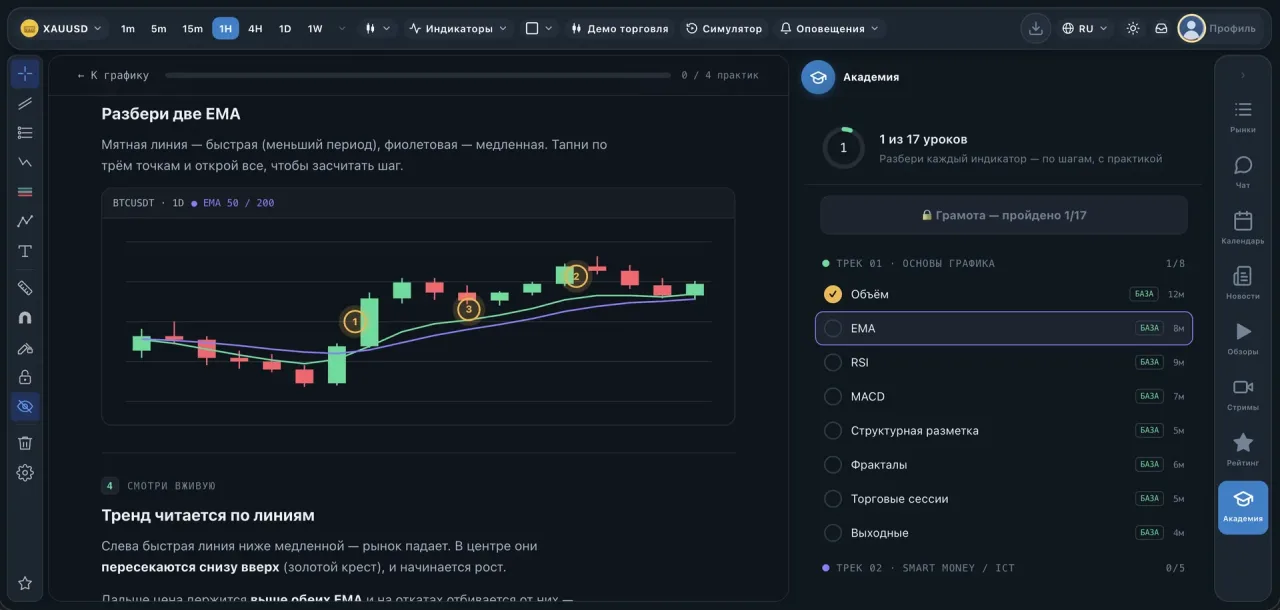
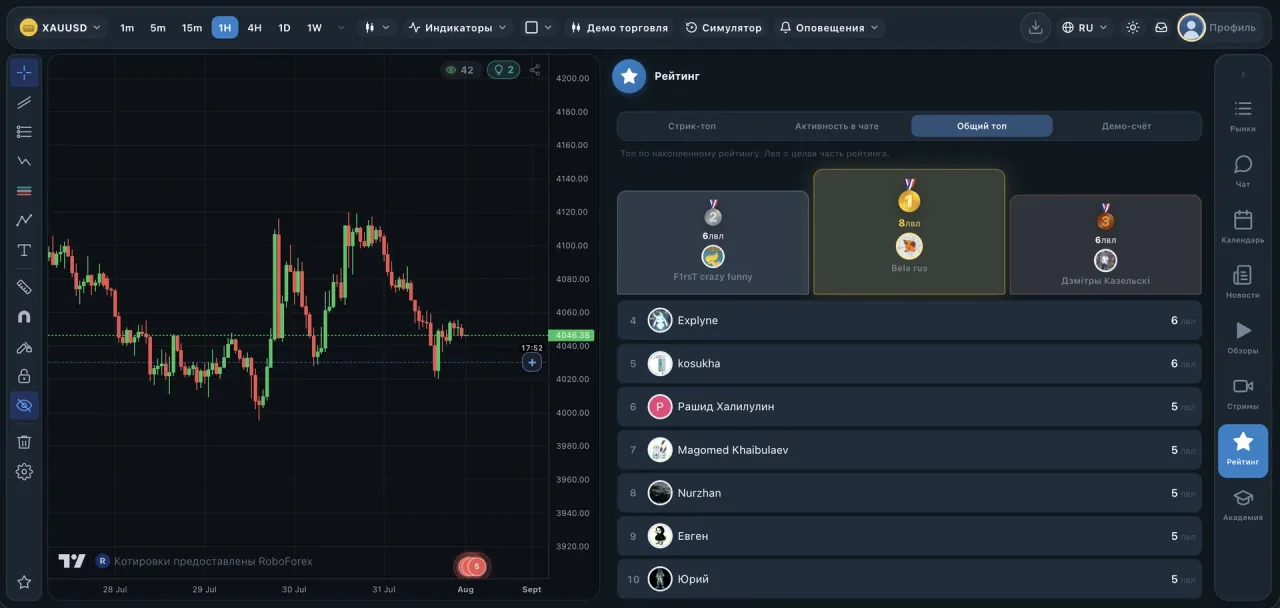
What you get here and pay for elsewhere
Footprint and order flow
Cluster charts: volume and delta at every price level inside the candle. Other platforms put this behind a paid tier — here it is open to everyone.
Heatmaps
Resting limit-order density and liquidations drawn on the chart — see where the size is parked and where leverage just got flushed.
Replay simulator, free
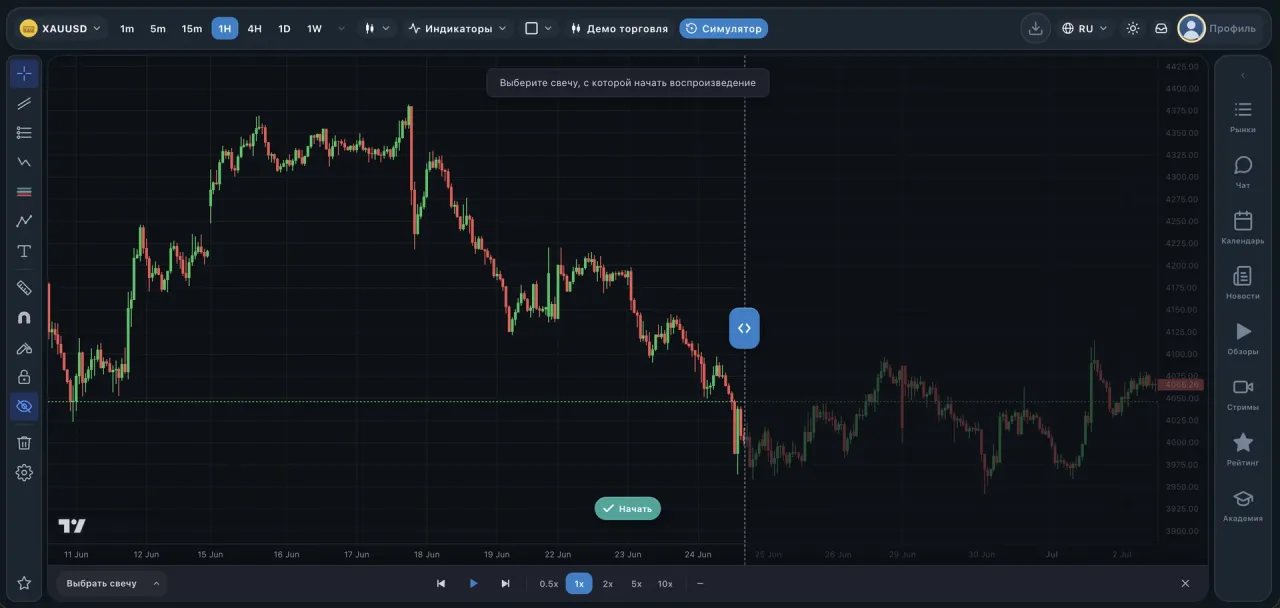
Rewind history candle by candle and practise entries on real data. Elsewhere this is a paid tier or a separate app.
Price alerts
Any level, no per-plan limits. Delivered to the browser and to Telegram even when the tab is minimised.
Drawing without limits
Trendlines, channels, Fibonacci, shapes and templates. Drawings anchor to candles and follow you across devices.
In-house indicators
Beyond the classic EMA, RSI and MACD — wave oscillator, market profile, structure mapping and trading sessions.
Community trade ideas
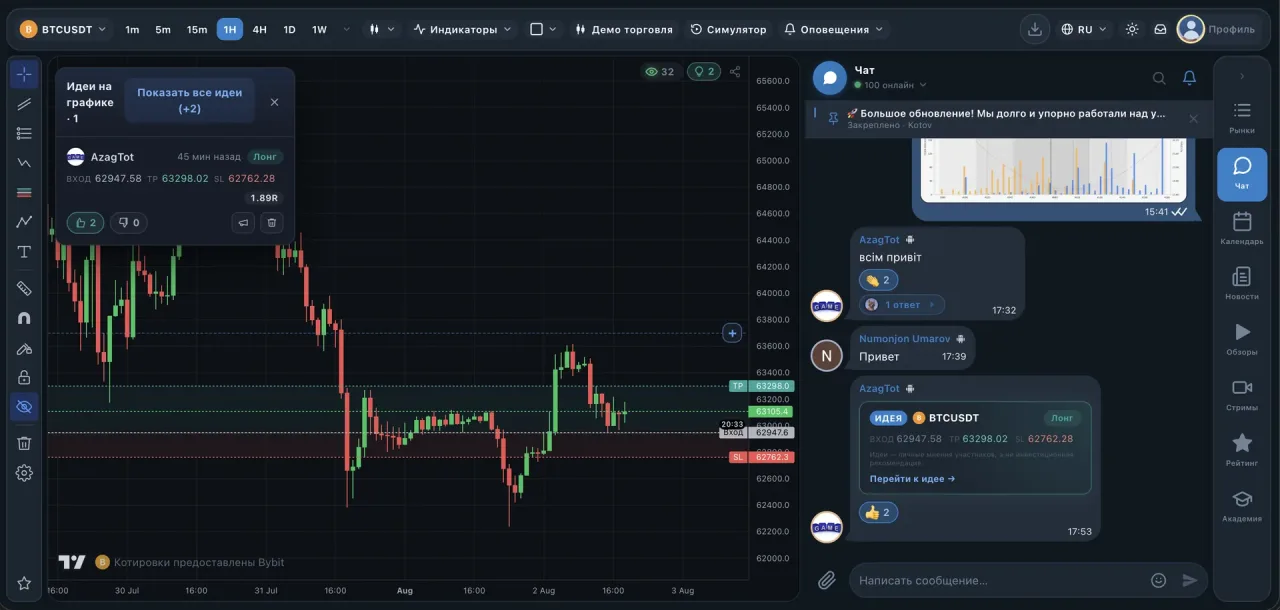
Ideas are published right on the chart with entry, take profit and stop. You see how they play out and who was right.
People next to the chart
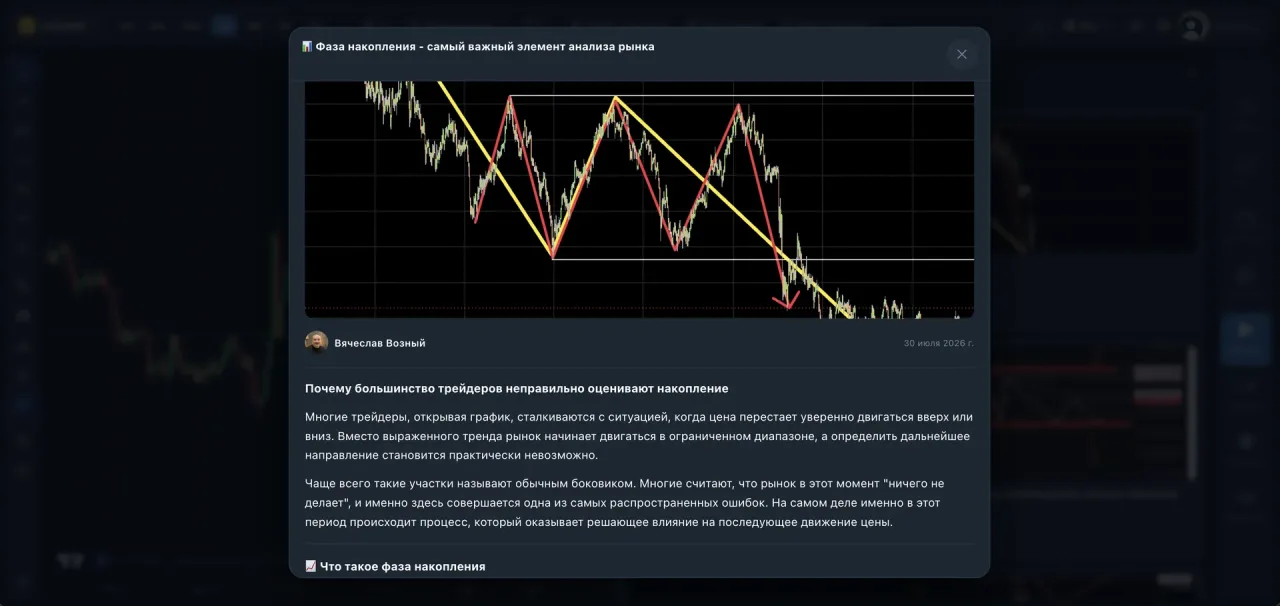
Chat, breakdowns from trading pros, ranked community ideas and the economic calendar — all in the same side panel.
All terminal features in detail →
Footprint and heatmaps are built from crypto exchange data, where a public trade tape exists. For forex and equities no such tape exists anywhere — not here and not at any competitor.
How to start
Sign in within seconds
With Google or Telegram, no forms and no email confirmation. No card needed
Open a breakdown and apply its markup
Levels from the breakdowns land on your own chart in one click - then you decide whether you agree
Practise the entry in replay
Rewind history candle by candle and test the idea before risking money
Latest market breakdowns
All breakdowns- How to Transfer Levels from Gold Futures to SpotIf you're watching levels on the Gold Futures chart but trading XAUUSD, the numbers won't match. Not because there's an error in the data somewhere, but because these are two different instruments with different settlement dates. The gap between them is called the forward point, and you need to be able to calculate it quickly.
- Gold XAUUSD: Break of 4282 or False Breakout?Gold has approached the lower boundary of accumulation at 4282 and closed right on it - 4282.07. This isn't an approach from a distance, this is already a touch, and sellers are now testing whether they have enough strength to push through the level.
- Drawdown on a Trade: Reduce or CloseThe most expensive mistake with a losing position is the urge to immediately do something about it. As long as price stays within the acceptable zone, being in the red isn't new information - it's just normal market behavior within the risk you already accepted. For me, the key thing here is separating the fact of a drawdown from the fact of a broken scenario.
Why it is free
Because serious tools should not be a privilege. Footprint, liquidation heatmaps, replay, drawing tools and alerts have been sold by subscription for years — we opened all of it to everyone at once, with no «pro» version, no caps and no trial countdown. We build the terminal we use ourselves, and we would rather have people next to the chart who want to figure the market out than people who could afford a plan. The more traders work with proper tools, the stronger the community around them — that is our interest.
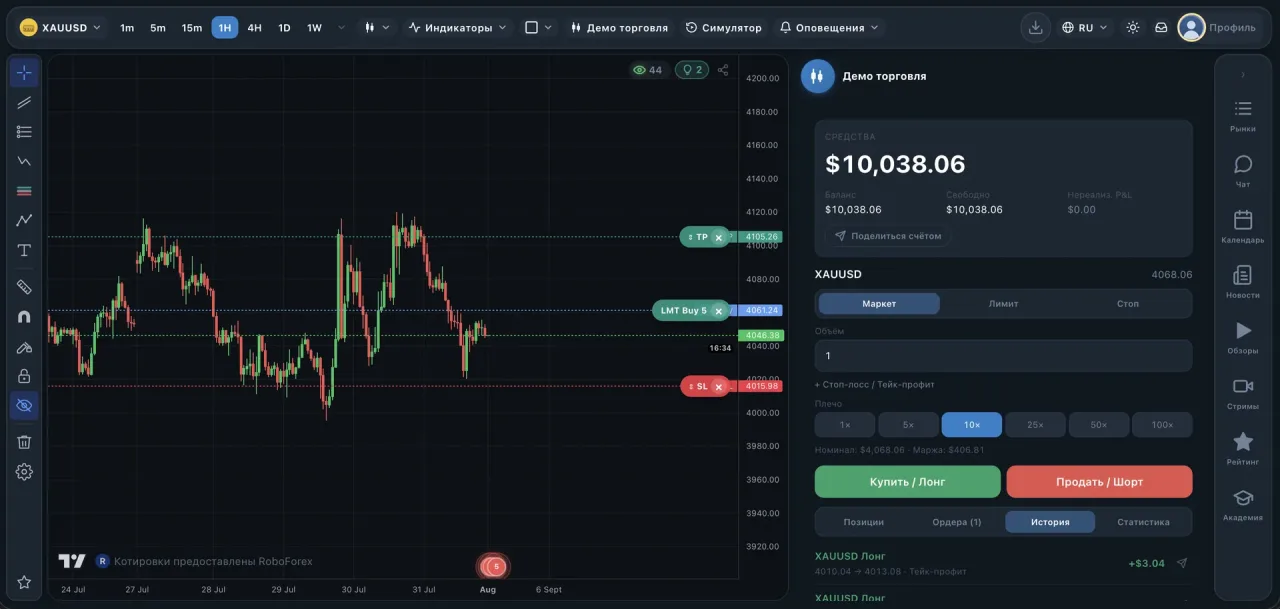
This is not a broker or an exchange: orders execute on a demo account and in replay. You trade real money wherever your account is held.
- No tiers - every feature is open from the start
- No card, no payment details asked
- No caps on alerts, instruments or drawings
- Nothing to install - it runs in the browser
Reviews from real users
Мне нравится эта платформа, нравится обучение, обзоры рынка, которые происходят здесь и нравится система Вячеслава. Спасибо большое за обучение и обзоры!
Дмитрий
Хочу оставить отзыв о WoznyM — действительно сильная платформа для тех, кто серьезно занимается трейдингом. Отдельно хочу отметить Вячеслава Возного. Очень ценю его способность ясно и без лишней воды объяснять, куда и почему может двигаться рынок. Для трейдера это особенно важно — не просто получить готовый сигнал, а понимать логику происходящего и видеть общую картину. Платформа удобная, информация подается понятно и структурированно. Чувствуется, что здесь основной акцент именно на понимании рынка, а не на пустых обещаниях легкого заработка. Для меня WoznyM — это прежде всего качественная аналитика, понятный взгляд на рынок и возможность развиваться как трейдер. Однозначно рекомендую тем, кто хочет глубже понимать движение рынка и принимать более осознанные торговые решения.
 LM
LMThe best there is! Keep up the good work, VV! I because consistently profitable after discovering you
Джалал
програма супер !!!!! платформа працює без глюків. респект авторам.
виктор виктор
Вячеслав, благодарю Вас за создание такой удобной платформы и за Вашу профессиональную и доступную аналитику.
Валерий Ушков
Платформа супер, вы создали нечто большее, чем просто платформа. Спасибо Вам!
Talisman.
Очень впечатлен платформой, нравиться проводить время. Сам Вячеслав очень добрый и хороший человек!
Ярослав
Платформа очень понравилась, так держать. Спасибо Вам!!
Супер. Спасибо.
Все супер👍🏻 отличная платформа симбиоз все самого необходимого!
Михаил Бернатович
Очень выверенная, удобная платформа - ничего лишнего. Огромное спасибо за Ваш Труд! Крепко жму Вашу руку!
Дуже зручна платформа. В'ячеслав все детально роз'яснює, з його допомогою рух ринків стає зрозумілим. На відміну від більшості інфоциган, які дають вам сигнали (які працюють як ймовірності), тут ви навчитесь мислити і приймати рішення самостійно. Найкращі рекомендації!
Ірина🐈⬛
Frequently asked questions
How much does it cost?
Nothing. There are no tiers, trials or paid features: footprint, heatmaps, replay, indicators and alerts are open to everyone right after sign-in.
Can I trade real money here?
No. VVozny is a terminal for analysis and practice: orders execute on a demo account and in the replay simulator. You open a real account with an exchange or broker separately.
Which markets are available?
Crypto, forex, metals (gold, silver), commodities, stock indices and US equities — around 80 instruments on timeframes from 1 minute to one week.
Do I need to install anything?
No, the terminal runs in the browser on desktop and mobile. No install and no email sign-up — you log in with Google or Telegram.
Why is footprint free when others charge for it?
It is built from the public trade tape of crypto exchanges — that data costs us nothing. For forex and equities no such tape exists at any service, so nobody has footprint there, us included.
How is this different from TradingView?
You do not pay for what sits behind their paid tiers: footprint, liquidation heatmaps, replay and alerts without limits. And the community lives next to the chart — breakdowns, member ideas and chat, not a separate social network.
Open a chart and look around
Signing in takes a couple of seconds, no card needed. Your drawings, indicators and settings stay with your account.
Open the terminal