
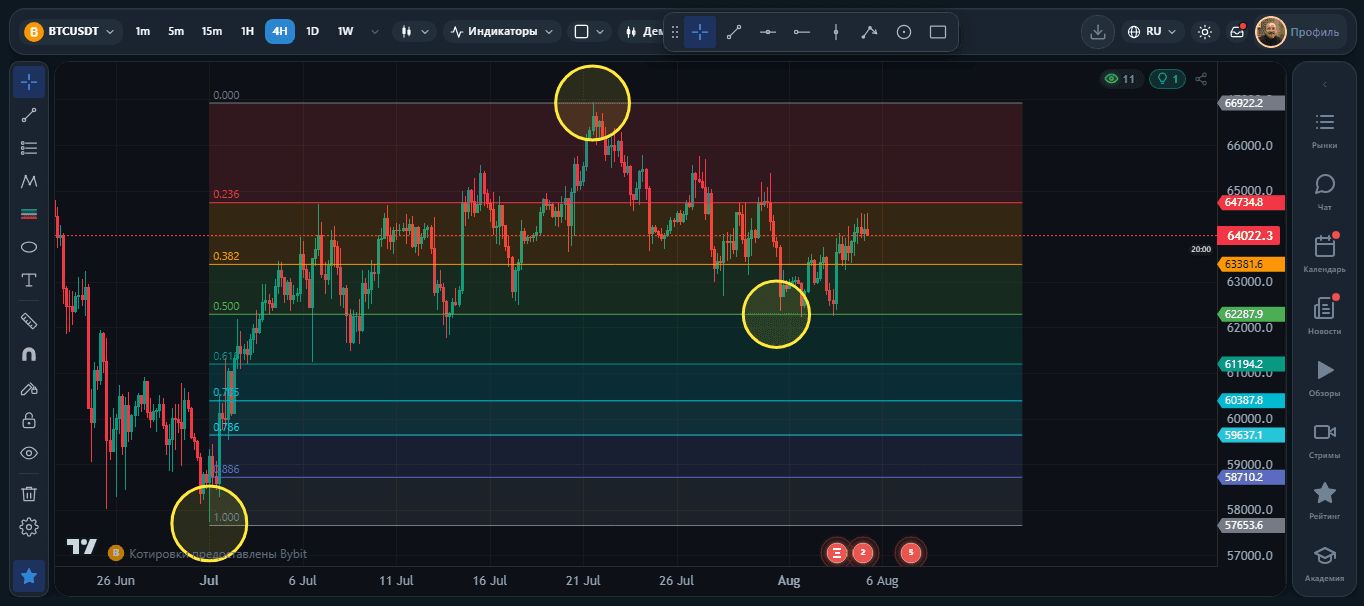
Even if you're not yet familiar with technical analysis, this information is easy to understand and can be extremely useful. You don't need to master dozens of indicators or complicated trading strategies to start reading the market. Sometimes, understanding just a few key price levels is enough.
In this article, we'll look at three important levels that can help you analyze corrections after a trend has completed.
📍 The Three Levels That Matter
For this method, we focus on just three key levels:
0% - the starting point of the previous trend. 100% - the ending point of the previous trend. 50% - the midpoint of that entire price move.
These levels help identify where buyers and sellers may become active once the market begins to correct.
The example shown uses Bitcoin, but this concept works on virtually any financial market.
📊 When Should You Use These Levels?
These levels should only be measured after a trend has completed and a correction has begun.
At that point, you already know:
where the move started; where the move ended; and you can easily calculate the midpoint - the 50% level.
The easiest way to find this midpoint is by using the Fibonacci Retracement tool, one of the most widely used tools in technical analysis. It automatically plots the key levels and makes chart analysis much easier.
🔍 What Do the 0% and 100% Levels Represent?
The 0% and 100% levels mark the reversal points of the previous trend.
These areas often contain the highest trading volume because they represent the beginning and the end of a significant price movement. For that reason, they frequently become important areas where traders look for new opportunities.
When price revisits one of these levels, traders typically watch for confirmation such as:
a breakout above or below the level; a rejection from the level; the formation of a new market structure.
These levels do not guarantee a reversal, but they provide strong locations for looking for high-quality trading signals.
🎯 Why Is the 50% Level So Important?
The 50% level deserves special attention.
In many cases, it becomes the primary target of a corrective move. Once price reaches the midpoint of the previous trend, the correction often begins to slow down, or the market may even resume the original trend.
Because of this, many traders use the 50% level to manage existing positions.
A practical approach may include:
closing the entire position; taking partial profits; moving the remaining position to break-even.
This allows you to protect realized profits while still giving the trade room to continue if the market keeps moving in your favor.
✅ Final Thoughts
The 0%, 50%, and 100% levels are simple yet powerful tools for market analysis. You don't need advanced technical analysis skills to use them. Simply identify the previous trend, wait for a correction to begin, and apply these levels to your chart.
One of the biggest advantages of this approach is its versatility. It works across virtually every financial market, including Bitcoin, Gold, Forex, stock indices, individual stocks, and many other assets. It can also be applied to any timeframe, making it valuable for both short-term traders and swing traders.