
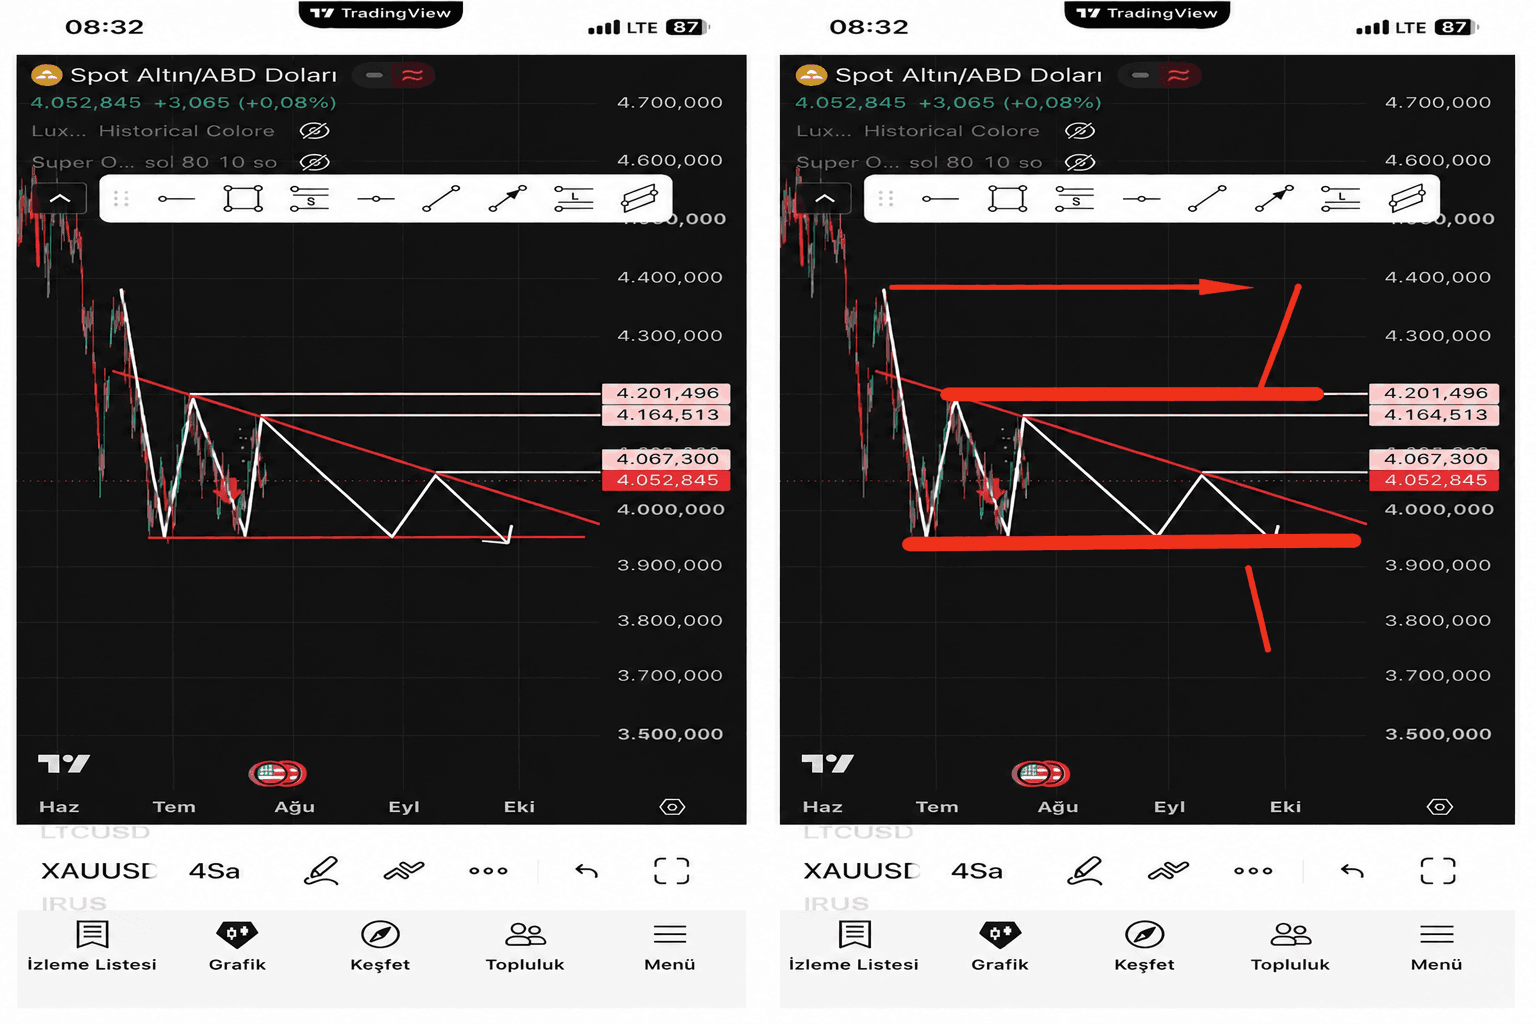
Colleagues, I want to raise an interesting topic for discussion, using gold (XAUUSD) as the example.
Thanks to the member of the chat who drew attention to this example. Situations like this are exactly what shows the difference between simply analysing a chart and understanding the logic of the market.
Very often traders spot a familiar pattern on the chart and decide that this alone is enough to make a trading decision. But it is worth asking yourself one simple question:
Why are market participants forming this particular structure? Where are they building positions, and how can you use that in your own trading?
It is the answer to that question that separates mechanical pattern recognition from conscious structural analysis.
📊 An example with a converging triangle forming
In the example given, a colleague expects a converging triangle to form with a squeeze to the downside.
The structure itself reads well and is clear to most market participants. It really isn't hard to spot on a chart.
But a far more important question arises:
What do you do with that knowledge next?
If a trader has simply identified the pattern but does not understand how to use it to find an entry point, there is little practical value in that analysis.
🎯 Every structure has to have a practical use
You very often hear:
"I see accumulation." "A triangle is forming." "Price is being squeezed."
But this information on its own gives you no trading edge.
If you are drawing some structure, you need to understand what information it gives you and what you are going to do once that model has finished forming.
That is exactly why any chart analysis has to answer not only the question "what is happening?" but also the question "how do I use this in trading?"
📈 The boundaries of the accumulation are the main reference points
In this example it is far more useful not simply to note that accumulation is present, but to define its actual boundaries.
Once the upper and lower boundaries are drawn, the structure turns from an ordinary pattern into a working analytical tool.
That lets you:
define the range of the accumulation; understand where the main reference points sit; work out in advance the levels beyond which a trend signal may appear; prepare a trading scenario before price even leaves the range.
This way attention shifts away from the pattern itself and towards its practical application
✅ The main takeaway
Any chart model has value only when it helps you make trading decisions.
It is not enough to see a triangle, an accumulation or any other familiar construction. What matters is understanding where its boundaries are and why a break of exactly those boundaries can be the basis for a trend signal forming.
It is this approach that lets you move from simply recognising patterns to a more conscious structural analysis of the market, and to use the models you find in real trading.