
Many traders run into the same problem. As the analysis goes on, levels, arrows, zones, labels and various notes pile up. After a while the workspace turns into a proper "Christmas tree", where it is already hard to see what actually matters.
In the platform chat a lot of people asked for the ability to open three charts of the same instrument at once. And it really is a useful feature. It lets you use one of the best-known methods in technical analysis — the "Elder's Triple Screen" strategy.
What the "Elder's Triple Screen" strategy is
The author of this method is Alexander Elder. As often happens, the strategy took his name.
The idea behind it is very simple, and yet it remains relevant even many years later.
You need to open three charts of the same instrument at once, but on different timeframes. For example:
H4 — the higher timeframe; H1 — the intermediate one; M15 — the working timeframe.
It is exactly this sequence that lets you see the market as a whole instead of making decisions from a single chart.
Why this is genuinely convenient
I have always held the view that analysing price has to start with the higher timeframe. That is where the overall structure of the market's move is formed.
After that attention shifts to the intermediate chart, where the development of the current move becomes clearer. And only then does it make sense to move to the working timeframe to look for trading opportunities.
When all of this has to be put on a single chart, confusion sets in very quickly. Levels of different scales, local and global highs and lows, various scenarios for price all appear on the screen at once. After a while, making sense of your own markup becomes no easy task.
Why use three charts at once
With three windows open, each task is solved on its own timeframe.
For example:
H4 shows the overall picture of the market; H1 helps assess the development of the current move; M15 is used for detailed analysis and for the work itself.
This approach makes the analysis significantly more comfortable.
Each chart stays clean. There is no need to fit all the markup into one window, hide elements or constantly toggle various objects on and off. As a result your attention is on the move in price, not on hunting for the right line among dozens of marks.
A practical example
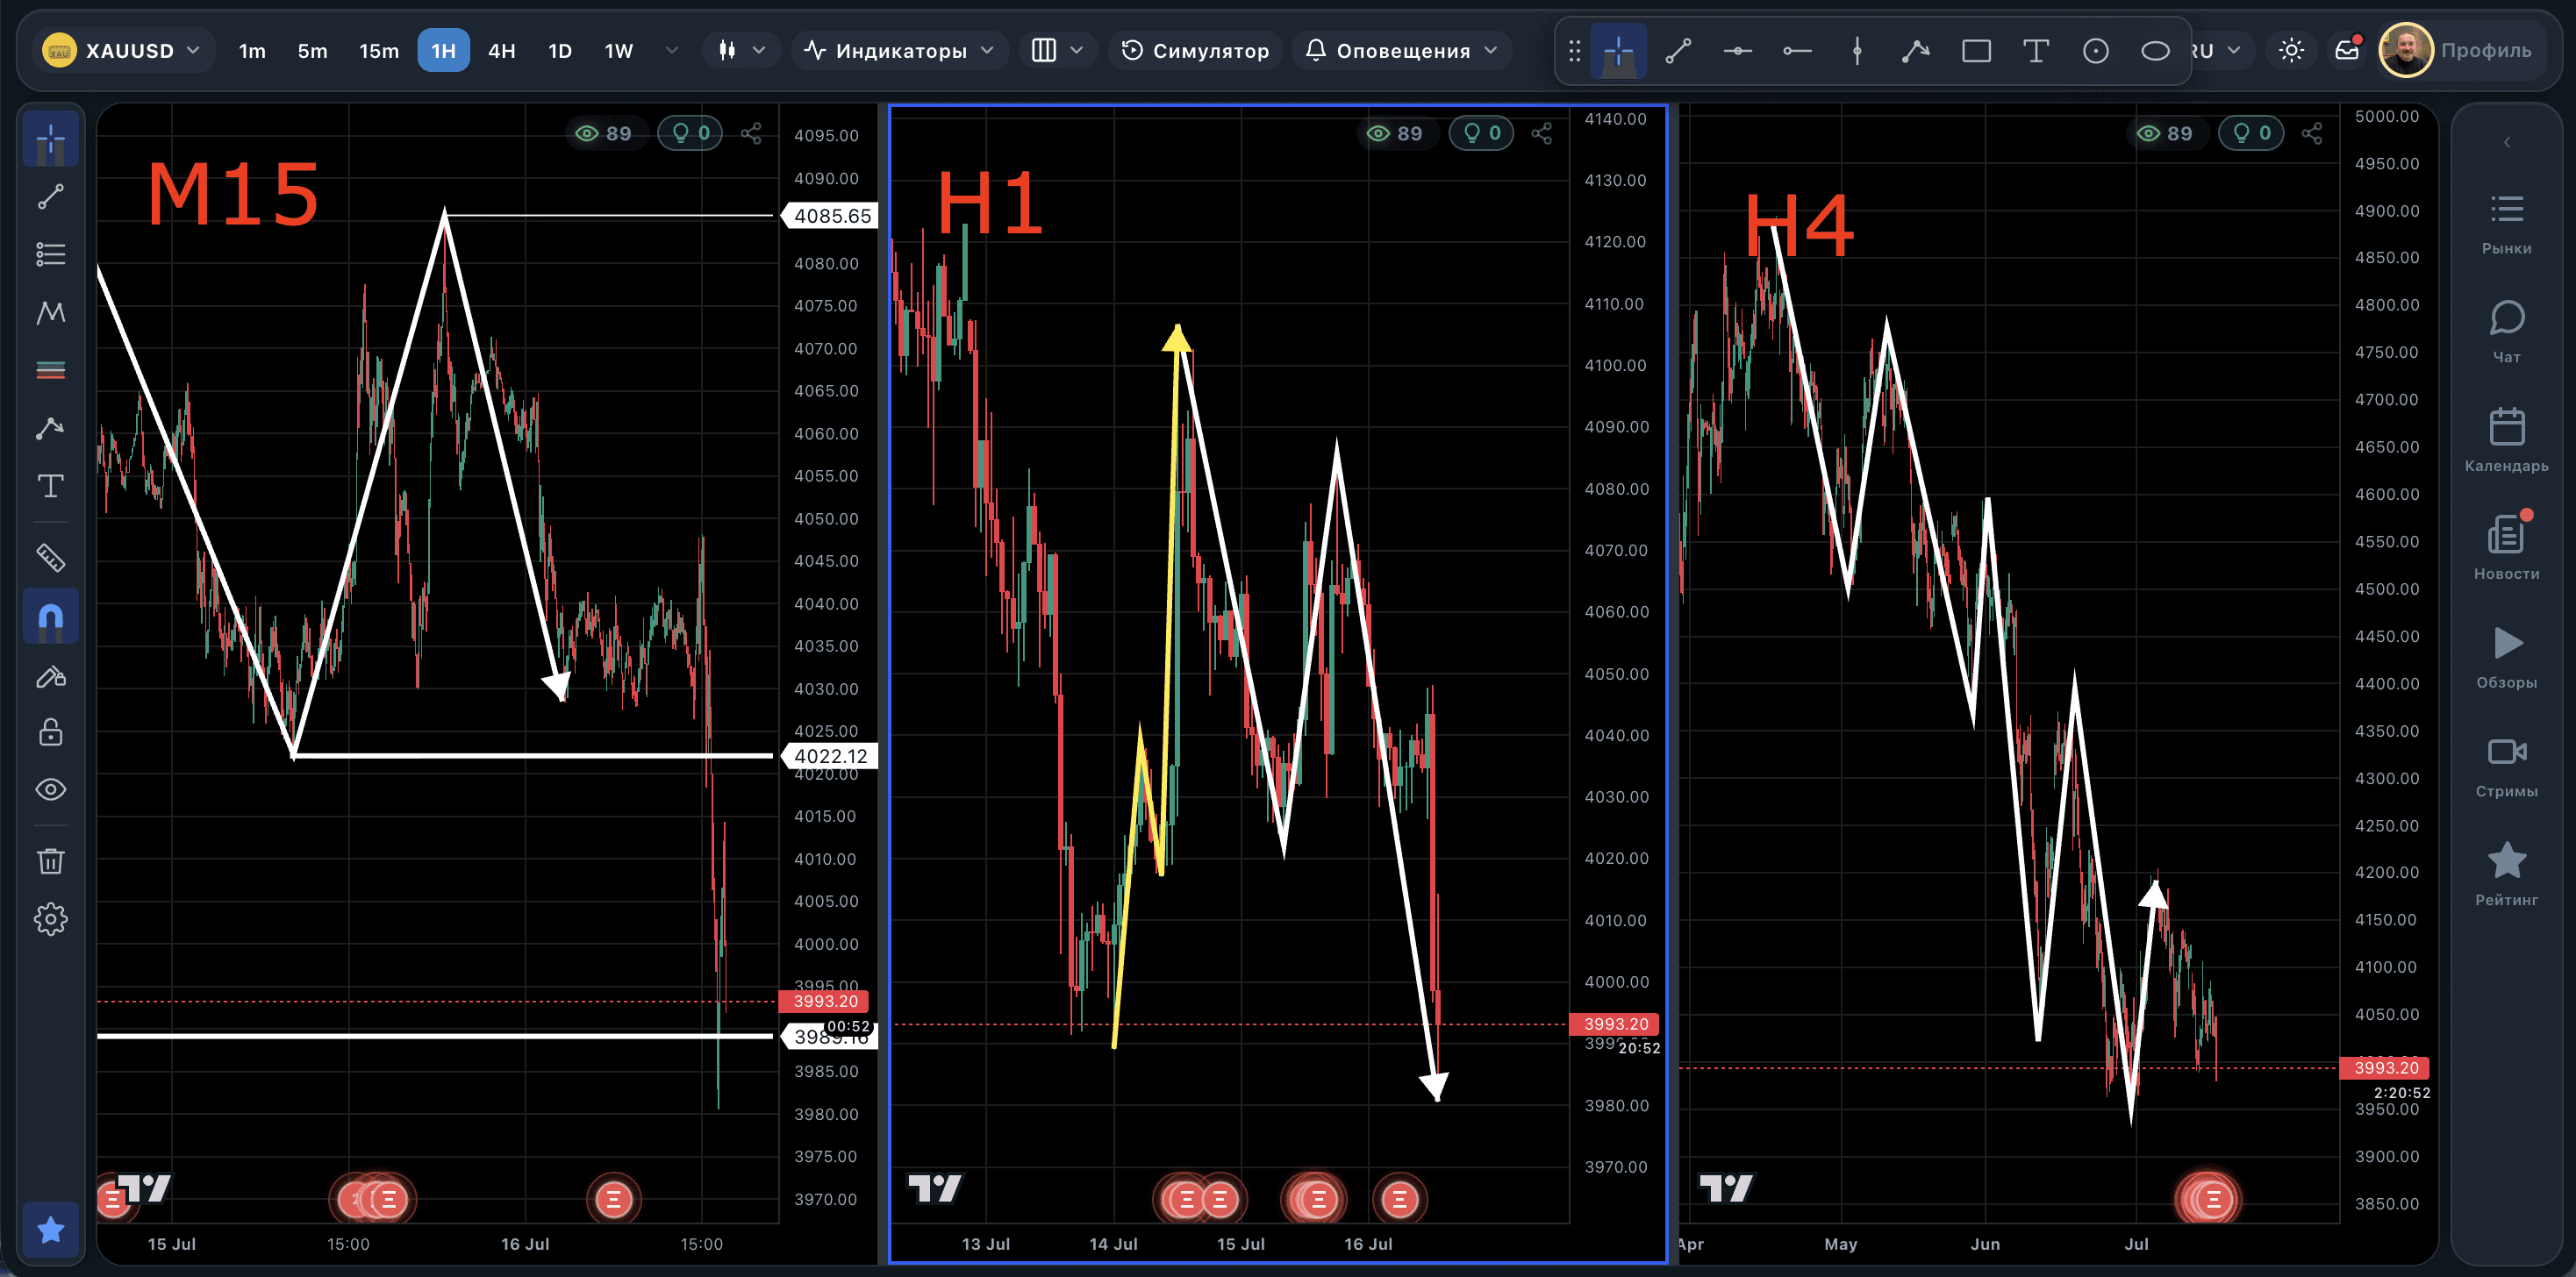
The image shows three windows of the same instrument at once.
On the H4 chart the overall structure of the market and the main direction of the move are clearly visible.
On H1 you can already assess the development of the current wave in more detail and understand how it fits into the higher-degree structure.
On M15 all that is left is to do the working markup and look for entry points without being overloaded with unnecessary objects.
This approach lets you switch quickly between the scales of the market without losing the overall picture.
Summary 💡
The "Elder's Triple Screen" strategy is still in demand not because it is a classic of technical analysis, but because it genuinely makes a trader's work easier.
From my own experience I can say that splitting the analysis across several timeframes noticeably reduces the number of mistakes. When the higher, intermediate and working charts are all in front of you at once, it is far easier to keep the analysis consistent and not lose the context of the move in price. And the charts stay clean, with markup that is clear and logical.
If you have the option to open three windows of the same instrument at once, I think it is worth using. It makes analysis more visual, more structured and significantly more comfortable in day-to-day work.