
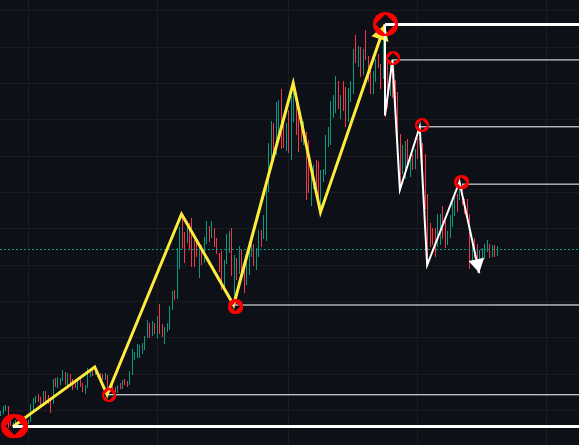
I treat chart scale not as a matter of convenience but as part of the analysis itself. How much history fits into the window determines whether I see the targets of a move or just stare at a chunk of candles with nothing to go on.
The two-moves-in-one-window rule
I format the chart so that two moves appear in the visible area at once: the one that already finished, and the one that's happening right now. The current move alone isn't enough - it has no context, and therefore no points to aim for.
The second condition matters more than the first. The previous move, from its start to its completion, must be larger in size than the current move. If what I've taken as the previous move is smaller than the current one, the scale is wrong and the targets will end up closer than they should.
In practice it looks like this: I zoom the window in or out until the screen shows a complete, large move in full, plus everything the price has done since then. No more, no less.
FAQ on chart scale
How many candles should be on the screen?
The number of candles doesn't matter - what matters is the content: a complete previous move in full, plus the current move after it.
What counts as a single move?
The price path from one reversal point to the next, meaning from the start of a directional move to its completion.
What if the previous move is smaller than the current one?
Zoom out further or switch to a higher timeframe until a move larger than the current one appears in the window.
Which timeframe should I start with?
The one you actually trade on, adjusting scale via the window; if the size condition isn't met, move up a timeframe.
Where the targets come from
From there, everything reads itself. I take the reversal points of the previous move as the main targets for the current price move. These are places where price has already reversed before, and they're exactly where it tends to head again.
With the right scale, two things are visible on screen at once: targets along the current trend, and targets in case the trend reverses. There's nothing to draw in - the boundaries of the previous move are already sitting right there on the chart.
That's why I don't build targets based on percentages or measure them out with a ruler from the entry point. The price history itself, within the window I've set, provides the reference points.
When it's time to switch timeframes
If price breaks through the boundaries of the previous move, that means it's no longer larger than the current move, and the reference points are gone. At that moment I switch to a higher timeframe and look for a new move there that's bigger than the current one.
After switching, the same rule applies: a complete large move in the window, the current move next to it, and the large move's reversal points as targets. Switching timeframes here isn't a change in trading style - it's a way to bring reference points back onto the chart.
FAQ on switching to a higher timeframe
When should I switch to a higher timeframe?
When price has moved beyond the boundaries of the previous move and the current move has become larger than the one you were comparing it to.
Do I need to go back to the lower timeframe?
Yes, as soon as the condition is met there again: the previous move is larger than the current one.
Why compare the size of moves at all?
Only a previous move that's larger gives you targets ahead of the current move; an equal or smaller one doesn't.
What should appear in the visible part of the chart?