
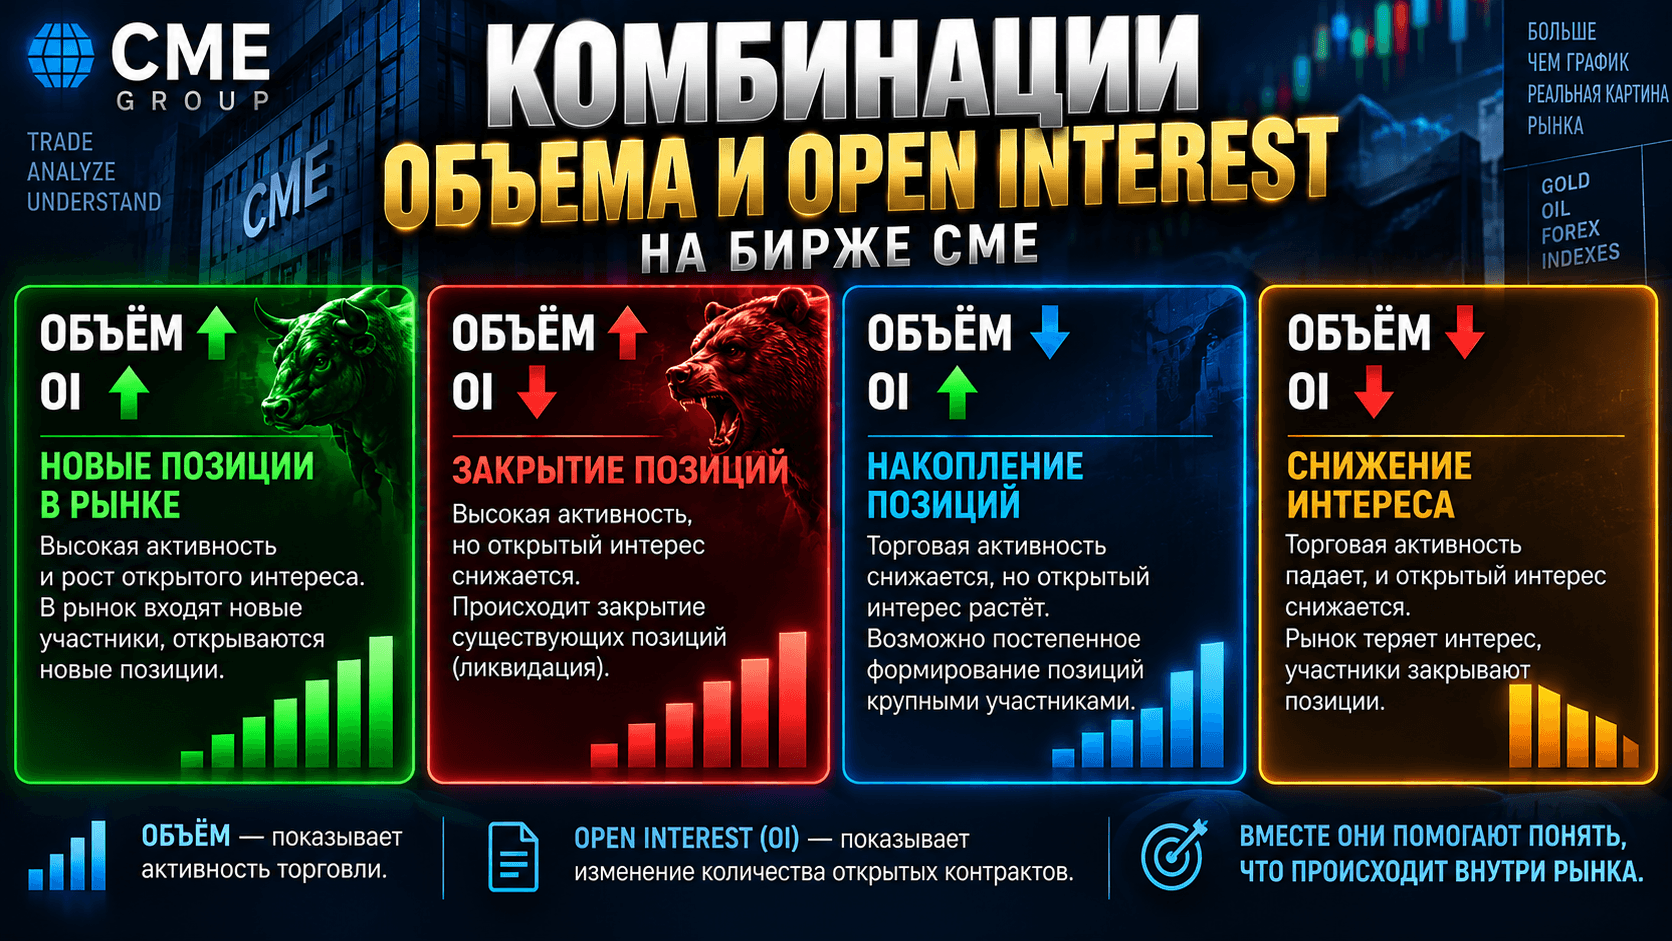
On the gold futures at CME I've got two numbers pointing in different directions. Volume tells me how many contracts changed hands during the session. Open interest tells me how many contracts remained open after it. A trade can open a new position, close an old one, or simply pass one from hand to hand - and that difference is what OI shows and volume doesn't.
Four combinations of volume and OI
Volume rising, OI rising. New participants are entering, fresh positions are opening. If gold is moving up at the same time, new buyers are behind the move, not just short covering. To me this is the "healthiest" pairing: the move has fuel behind it.
Volume rising, OI falling. Lots of trading, but the contract count is shrinking - meaning previously opened positions are being closed. On a sharp selloff in gold this is usually long liquidation; on a sharp spike up, it's short covering. The move can be strong in amplitude, but it's fed by old positions exiting, not new ones entering.
Volume falling, OI rising. Activity is sluggish, but there are more and more contracts in the market. Positions are being built gradually, without pushing price around. This kind of accumulation often drags on for days in a tight range and ends with a breakout from it.
Volume falling, OI falling. Both activity and positions are leaving the market. Interest in the current move is fading, and what usually follows is a petering out or a range until the next catalyst.
Common questions about the combinations
Where do I check open interest for gold?
CME publishes preliminary OI in the evening after the session closes and the final figure the next morning, so the number always arrives with a one-day lag.
What's the plain-language difference between OI and volume?
Volume counts every trade over a period, including contracts just passing between traders, while OI counts only the contracts that are actually still open.
Why doesn't OI show who's buying and who's selling?
Every open contract has both a buyer and a seller, so rising OI tells you about new positions, but not about their direction.
How not to confuse accumulation with rollover
Gold's biggest trap is the transition between contract months. The active series for GC are February, April, June, August, December, and a couple of weeks before expiration participants roll their positions into the next one en masse.
On those days volume spikes upward, OI in the front-month contract drops sharply, and OI in the deferred one rises just as sharply. Reading this as "mass position closing" is wrong: the positions didn't close, they moved. That's why during rollover periods I only work with total OI across all series and discount the spike as technical in nature.
The second common mistake is looking at OI intraday. It's calculated once, at the end of the session, and there's simply no intraday reading for it. Everything available on a five-minute chart is volume.
What to actually do with this on the chart
The volume-OI pairing doesn't tell you where price is going. It tells you what's actually paying for the move that already happened. That's why I always read it as a third layer: first structure and levels on gold, then candle behavior, and only then whether OI confirms new money coming in or old positions unwinding.
The moments most useful to me are when price and OI diverge. Gold makes a new high while OI falls on high volume: there are no new buyers, shorts closing out are pushing it up. Or price sits still for several sessions while volume falls and OI rises - positions are being built quietly, and that kind of stretch rarely leads to nothing.
Common questions about applying this
What does rising gold price with falling open interest mean?
Most often it's short covering: the move up is happening because sellers are exiting, not because new buyers are stepping in.
How many days of rising OI counts as accumulation?
I look for at least 3-5 consecutive sessions of rising OI with sluggish volume inside a tight price range.
Can OI tell me where to enter a trade?
No, these combinations describe the character of the flow, the entry point comes from price and structure on the chart.
How do I tell rollover apart from a genuine position exit?
If OI falls in the front-month contract but the total across all series barely changes, that's a position roll, not an exit from the market.
Volume on gold futures is rising while open interest is falling. What does this most often mean?