
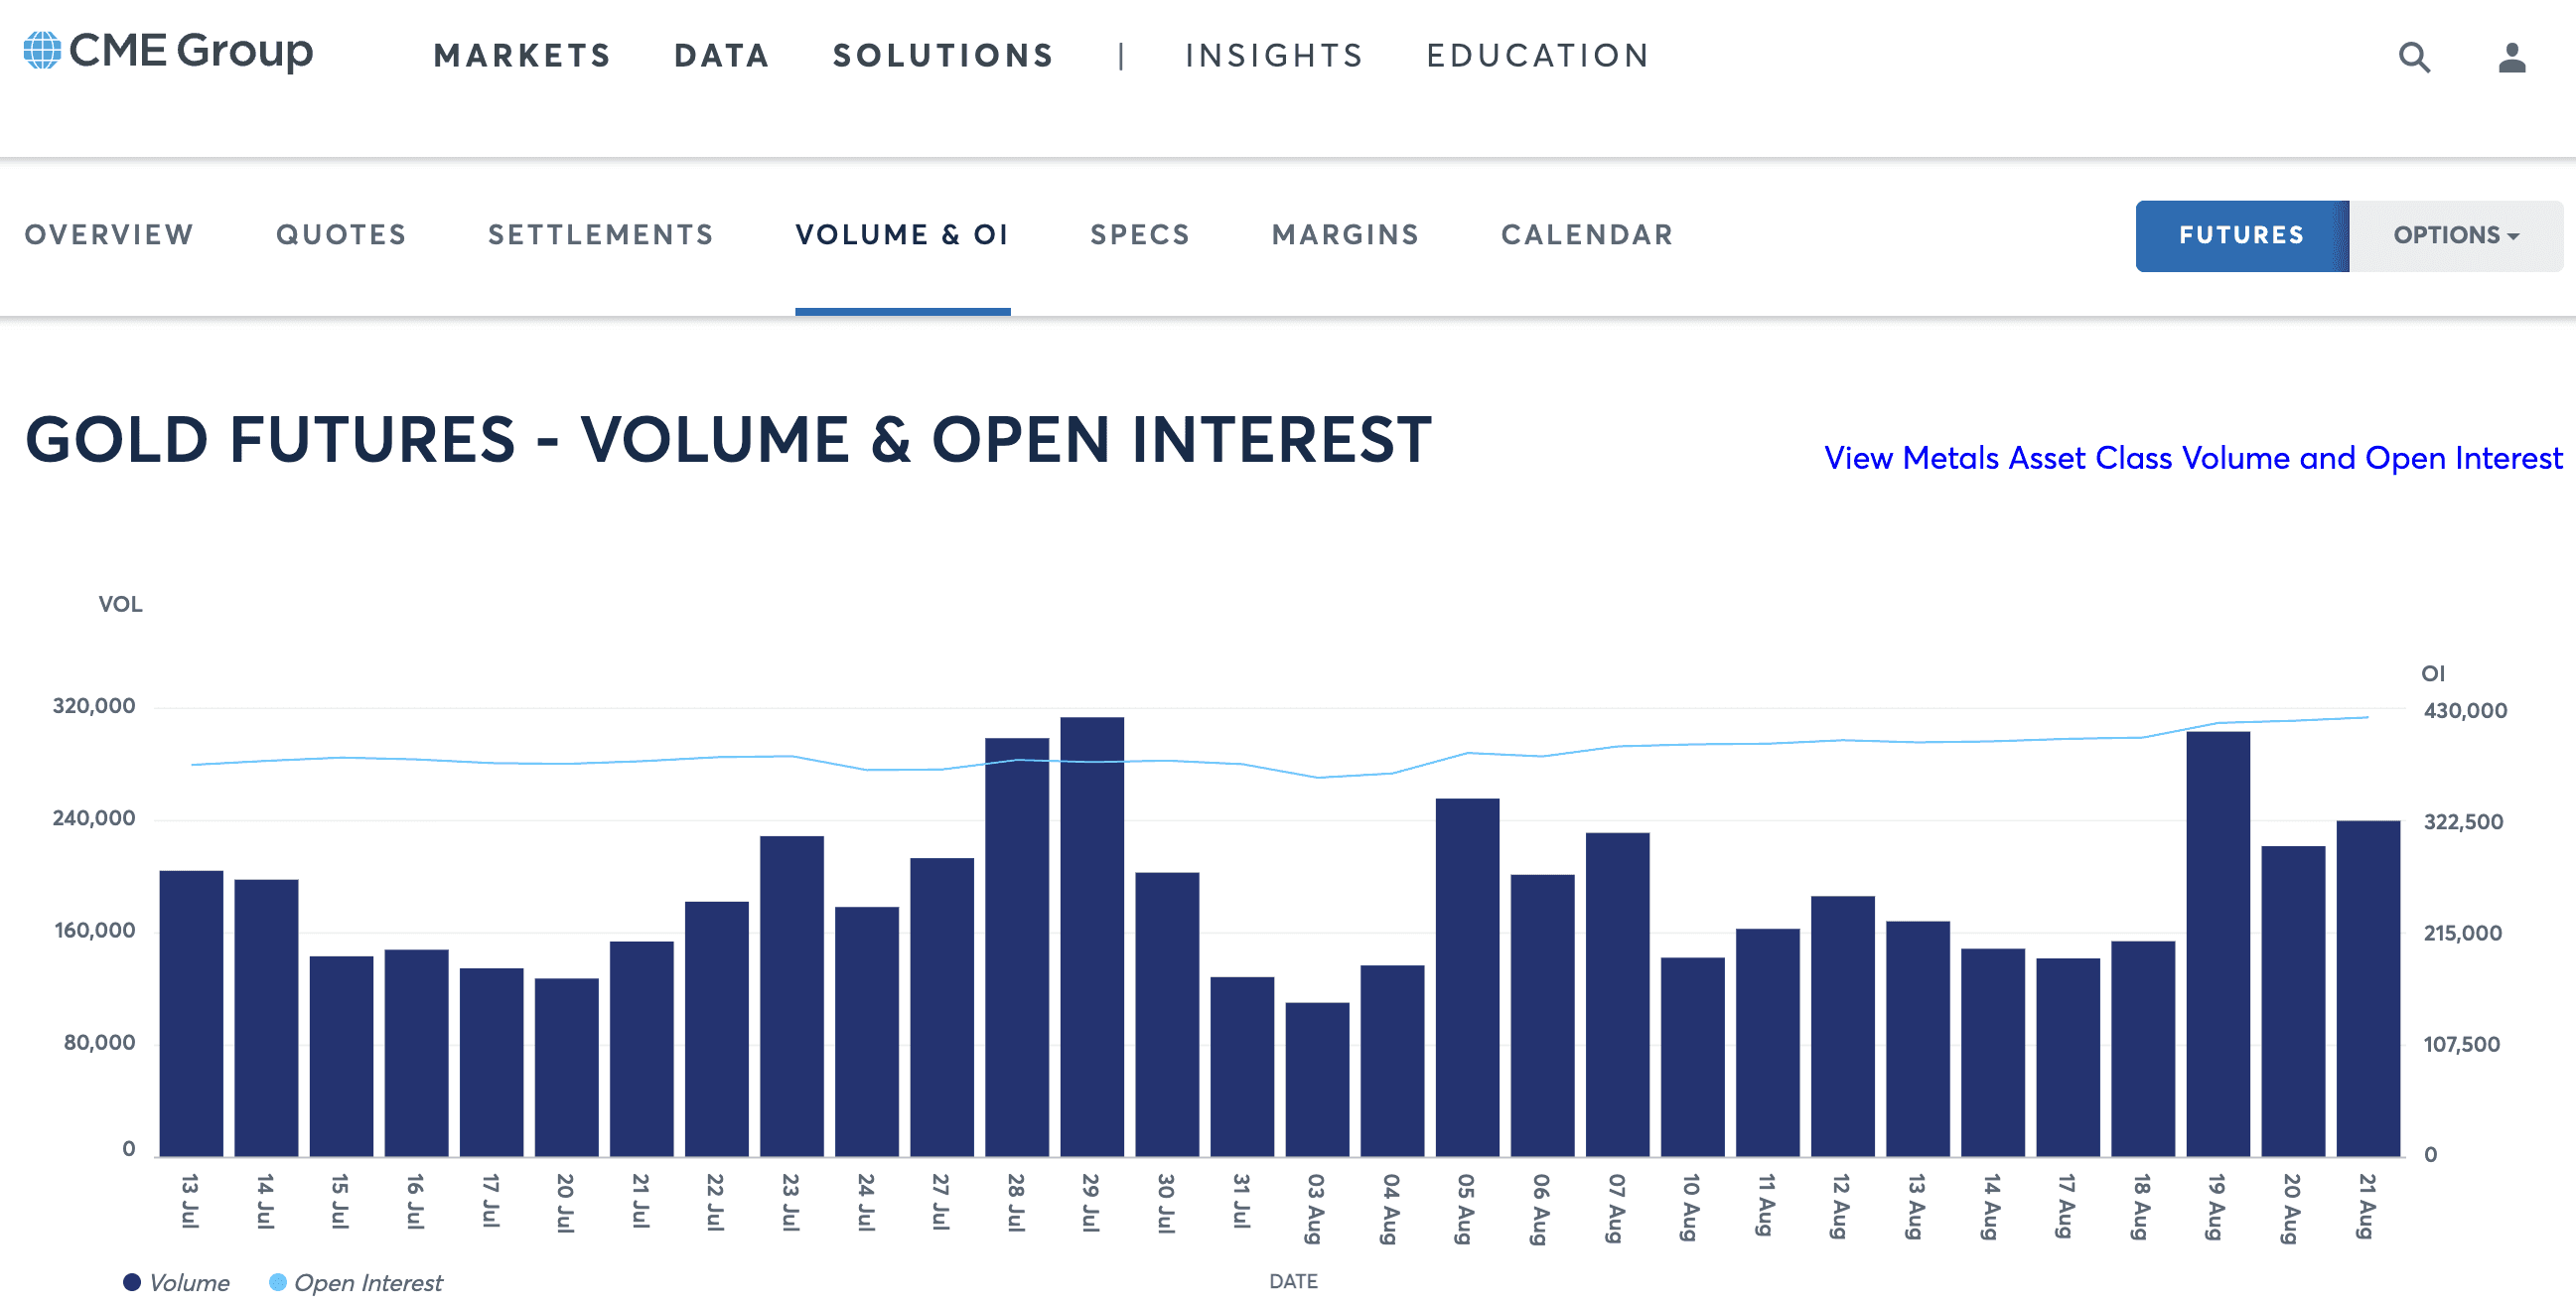
I look at gold not just through candles, but through CME data too. Since early August, the picture there has been consistent: price rises, and open interest rises right along with it. To me that's a separate argument the candlestick chart alone can't give.
What open interest actually shows
Open interest is the number of contracts still open at the end of the trading day. Not how many times they changed hands, but how many positions are actually sitting in the market. Every unit of OI is a pair - a buyer and a seller - who haven't parted ways yet.
That's where the difference from volume comes in. Volume can be huge on a day when the same contracts pass from hand to hand intraday and get closed out by evening. OI won't budge in that case. And the reverse holds too: a quiet day by volume can still produce a noticeable OI increase if the money that came in is staying put.
That's exactly what I'm seeing in gold: volume shifts from day to day, while OI shows a clear upward trend. This mismatch is precisely what tells you positions are being built, not just rotated.
What's the difference between open interest and volume?
Volume counts all trades over a period, while OI counts only contracts still open at day's end - in other words, positions actually being held.
Where can I check gold's open interest?
On CME data, where gold futures trade; spot XAUUSD has no OI of its own and relies on that same futures data.
Why does OI rise more smoothly than volume?
Volume is sensitive to intraday activity and news, while OI only shifts when positions are seriously opened or closed.
Why the 'price up, OI up' combo matters
There are four basic combinations of price and open interest, and each one reads differently.
| Price | Open Interest | How I read it |
|---|---|---|
| Rising | Rising | New money is entering the move, the trend is supported |
| Rising | Falling | Rally is short covering, running out of fuel |
| Falling | Rising | Shorts are being actively built |
| Falling | Falling | Just an exit from positions, not fresh selling |
Gold has held to the first row of that table since August. Positions in the market aren't shrinking - they're being maintained and added to as price climbs. As long as this structure stays intact, I rate the odds of continued upside higher than a drop.
What to watch next
There's one main question now: how far are buyers willing to keep holding their positions. The answer to that will show up in OI before it shows up in price.
For me, the signal of a shift would be a divergence: price keeps making new highs while open interest starts to decline. That would mean the rally is running on position closing rather than fresh money, with less cushion underneath than the chart suggests.
The second scenario is a sharp OI collapse alongside a price pullback. That would point to a mass exodus from longs, and the structure that's held since August would break down.
Frequently asked questions
Does rising OI guarantee trend continuation?
No, it only shifts the odds: the move is backed by fresh money, but that doesn't rule out a reversal at any level.
How often is open interest data updated?
Once a day, after the trading session closes, so OI is by nature a day behind price.
What if OI is falling while price rises?
Treat that rally as less reliable: it's running on short covering rather than an inflow of new buyers.
Is OI useful for day trading?
Not really: its daily update cycle makes it a tool for reading structure, not for timing entries.
Gold's price is rising, and open interest is rising too. How should this be read?

