
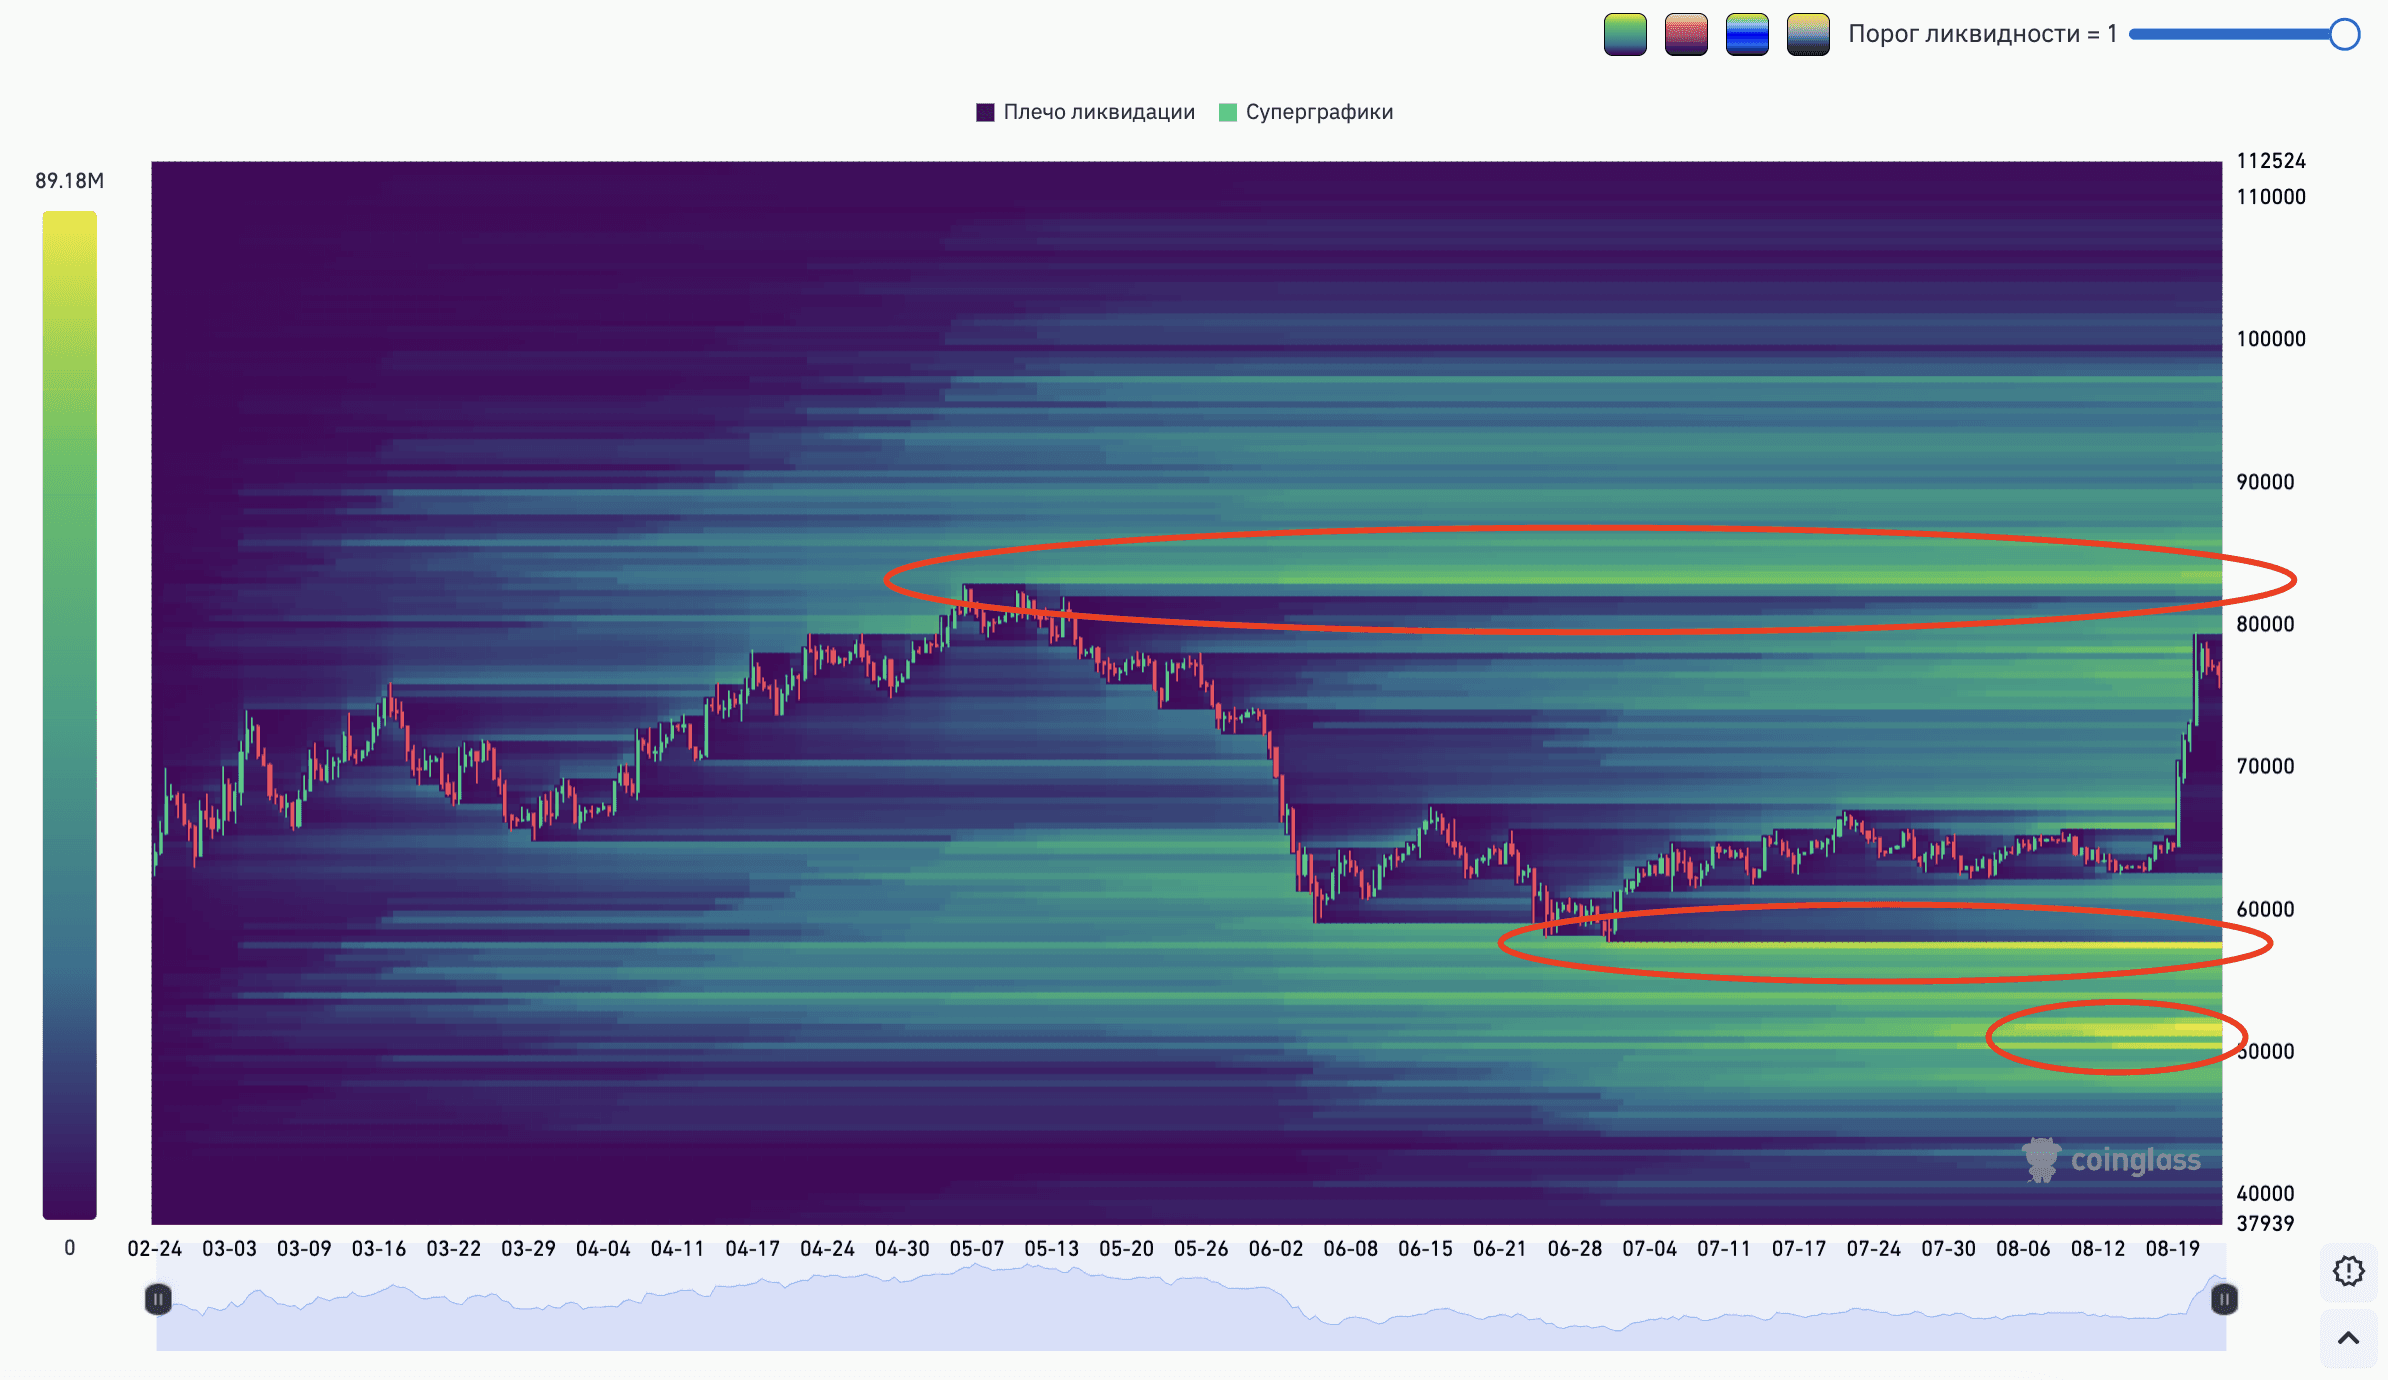
I never read the liquidation map separately from structure. On its own, it only shows clusters of leveraged positions - it's structural analysis that gives these clusters meaning, by showing where large players are sitting and which points on the chart matter for them.
Where liquidations sit on the map
Look at the map and one thing becomes obvious: dense bands of liquidations don't sit in the middle of the range - they sit behind key reversal points. Behind the last high and behind the last low. That makes sense: these are the extremes participants measure their risk against, and that's exactly where stops and forced-closure levels pile up.
That's why price so often moves not toward what looks "clean" on the chart, but toward wherever leveraged volume has built up. A move toward a cluster isn't magic - it's simply the most accessible source of counter-liquidity.
Why do liquidations cluster right behind the high and the low?
Participants measure their risk from these points, which is why stops and forced-closure levels pile up right behind the extremes.
Does the liquidation map show the future?
No, it shows the current distribution of leveraged positions and what would happen if price reaches a specific level.
Why there's no trend change without liquidations
Here's what matters most to me: as long as large players haven't been liquidated, there's no point talking about a trend change - or even an attempt at one. Their positions are intact, they're not losing anything, so there's nobody forced to reposition.
A trend change doesn't start with a pretty candle or a broken trendline. It starts when holders of the bulk of the volume are forced to close out. Until that happens, any counter-move is still just a move within the old structure, no matter how confident it looks.
How is the liquidation of large players different from an ordinary breakout?
An ordinary breakout wipes out small stops, while liquidating large positions hits the levels the entire structure is built around.
Can breaking a trendline be considered a trend change?
As long as the key reversal points haven't been broken and leveraged positions haven't been closed, it's still a move within the previous structure.
What I see on Bitcoin
Looking at the Bitcoin liquidation map, the picture is this: the upward impulse didn't hurt large players. There was an impulse, but it never reached the dense clusters, and the key reversal points remained untouched.
Which means there's no reason yet to talk about a reversal. I'm not waiting for price growth as such - I'm waiting for a specific event: price reaching a cluster and clearing it out. Until then, the rally reads as a move within the structure that's already in place.
How to connect the map with structure in practice
I always follow the same order. First, structure: where's the high, where's the low, which reversal points are holding up the current move. Then the map: do the liquidation clusters line up with those points, and on which side of price is there more of them.
If clusters sit above and the structure is bullish, the upward move gets fuel. If the bulk of liquidations is already behind and price is moving away from it, I don't expect continuation out of thin air. And as long as the large volume remains intact, any talk of a trend reversal is, to me, premature.
Frequently asked questions
What timeframe should I use to read the liquidation map?
The same one you use to mark out structure: clusters need to line up with the highs and lows you're actually using in your analysis.
What if there are large clusters on both sides?
Look at the structure: it tells you which side matches the current direction of movement, and which side would only become a target if the trend broke.
Will price definitely reach a liquidation cluster?
No, there's no guarantee. A cluster is a place where liquidity is concentrated, not a mandatory target.
How do you know large players have already been wiped out?
By a broken key reversal point together with a clear spike in liquidations right behind it - not by a single long candle.
Where do liquidations most often cluster on the map?