
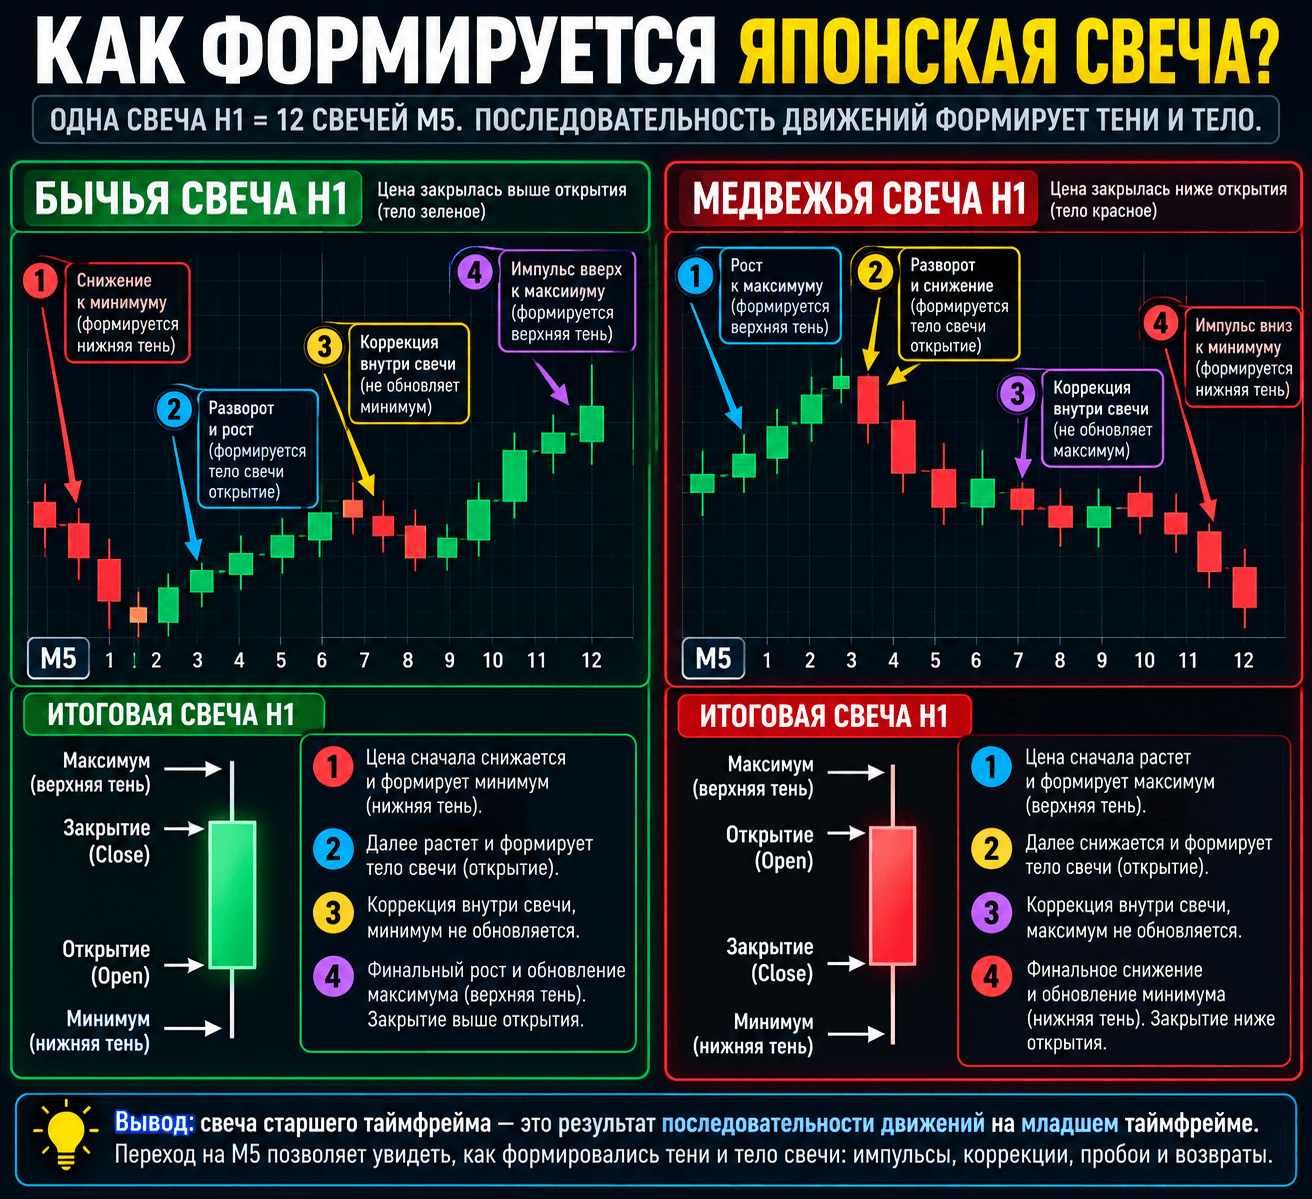
A candle gives you four numbers: open, close, high, and low. Everything that happened between them gets compressed into one shape, and that compression is usually exactly what misleads you.
What a candle shows and what it hides
An hourly candle with a small body and a long lower wick can mean completely different things. Price might have dropped first, then spent the rest of the hour grinding back up. Or it might have sat near the open for almost the entire hour and then shot down and back up in the last five minutes.
You can't tell these two scenarios apart from the candle itself: the body and wicks will look similar either way. A candle captures the hour's result, not the route price took to get there.
The same goes for levels. A breakout that closed back inside the range looks like a simple wick on H1. On M5, you can see how long price actually spent beyond the level, whether it managed to hold there, and what exactly pulled it back.
Common questions about candle structure
How many M5 candles make up one H1 candle?
Twelve. An H4 candle contains four hourly candles, and a daily candle contains twenty-four.
Can you tell from a candle which came first - the high or the low?
No, the order of the extremes isn't encoded in the candle. You can only see it on a lower timeframe.
Why look at M5 if I trade off H1?
To understand how the hour's result actually formed: whether the breakout held or was just a one-off spike.
What an hour looks like from the inside
A typical sequence inside one candle goes like this. First, a narrow range over a few five-minute bars - price churns near the level, the range tightens.
Then an impulse beyond the boundary: one or two M5 candles push price past the level. If nothing follows and price comes back inside the range, the higher timeframe is left with a wick.
Then a reversal: price moves in the opposite direction from where it got pushed. On H1, this closes as a single candle with a body in the opposite direction, and the whole backstory disappears.
Common questions about wicks and spikes
How does a spike differ from a breakout on the lower timeframe?
A spike goes past the level and comes back within one or two M5 candles, while a breakout holds there through several closes.
What does a long wick toward a level tell you?
That price got pushed past the level and pulled back, but you can only see the reason for the pullback at the lower scale.
What if the wicks on both sides are long?
That candle usually contains two opposing pushes: M5 shows which one came last and where price was heading into the hourly close.
How to combine the two scales
The split is simple: levels and the big picture stay on your working timeframe, the formation details go to the lower one. Move your decisions down to M5, and your trade count grows while quality drops.
| Scale | What it gives you | What it costs you |
|---|---|---|
| H1 | Clean levels, less noise | You can't see how the candle actually formed |
| M5 | The structure inside the candle | Plenty of false moves |
Getting into the habit of opening an important candle on M5 right after it closes costs you a couple of minutes, but it changes how you read the chart. You stop seeing shapes and start seeing a sequence of actions: where entries happened, where stops got swept, where reversals began.
Common questions about working with two timeframes
Which lower timeframe should I use to break down H1?
M5 or M15: the first gives you twelve candles within the hour, the second gives four - either is enough to see the structure.
Do I need to trade from the lower timeframe?
Not necessarily. It can be used purely for reading, while entries stay on your working scale.
Does reviewing candles after the fact actually help?
Yes, breaking down closed candles at significant levels is more useful than watching the current one form in real time.
What can't you determine from a single H1 candle?