
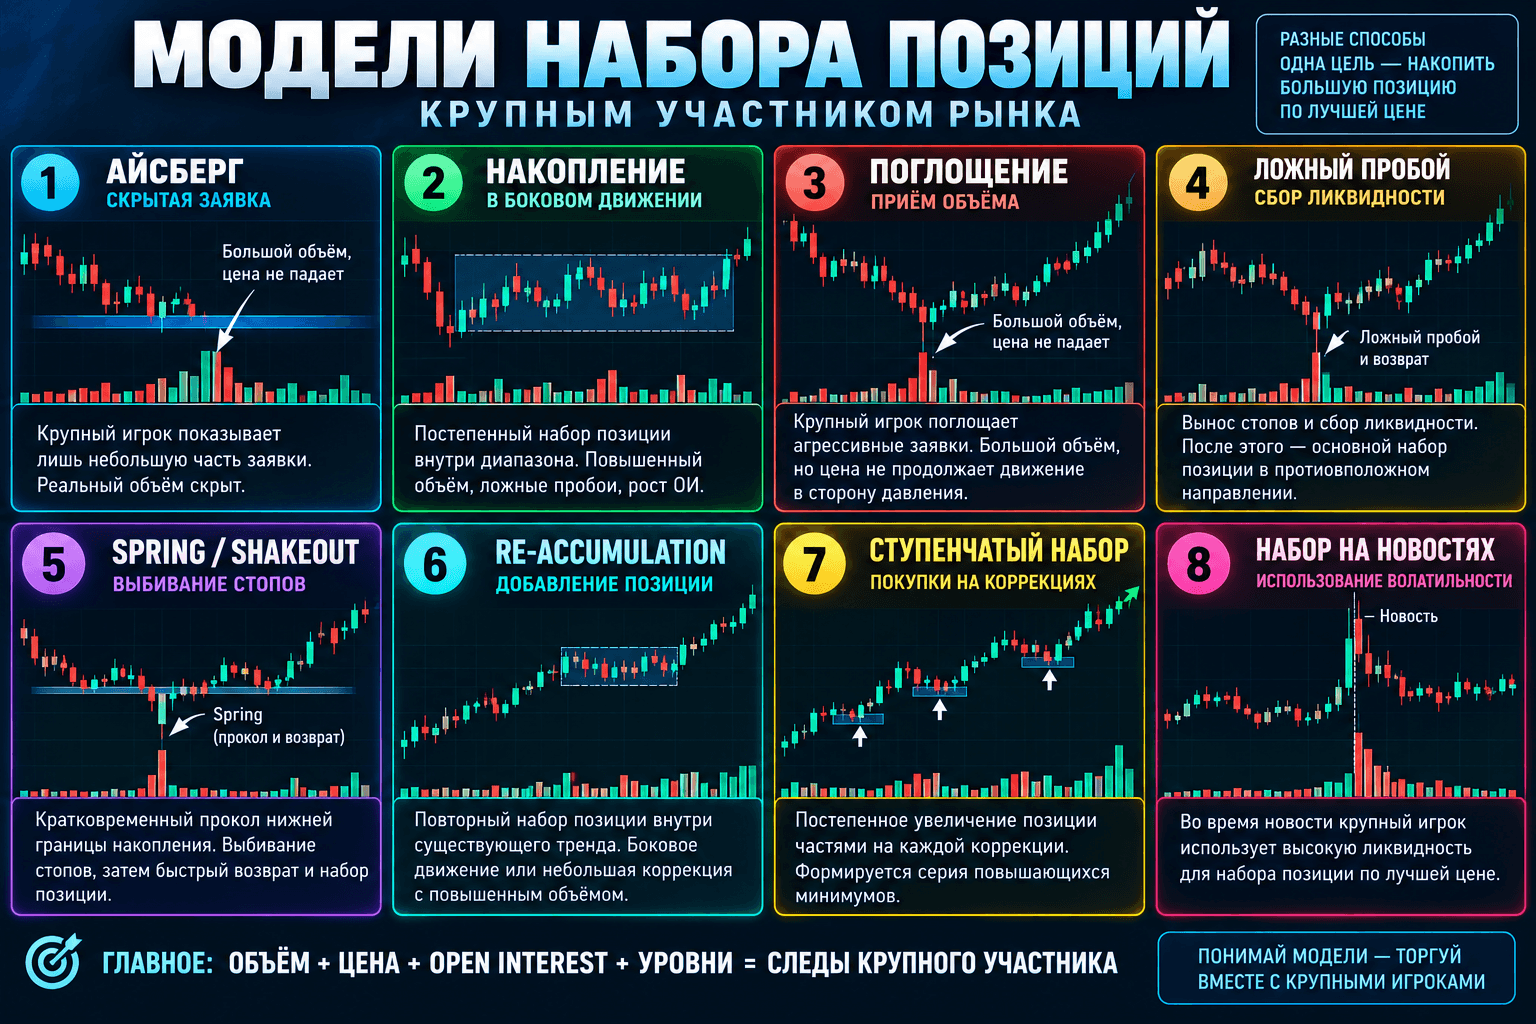
A large position can't be built with a single click - the market simply won't offer that much liquidity at the price you want. So building a position always stretches out over time and gets disguised as ordinary trading. Below I break down the patterns I use to spot it, and the combination of data I look at on CME.
Seven position-building patterns
Iceberg - a large order where the market only sees the tip. A small size sits in the book, gets filled, and reappears again and again at the same price. This is the clearest sign that someone is working a limit order and doesn't want to reveal the full size.
**Accumulation - gradual building inside a sideways range. Price moves between the boundaries, volume within the range is high, but it goes nowhere. Absorption** is a related story: a big volume print comes in and price doesn't react, staying put. That means whatever is being sold is getting absorbed by someone.
False breakout - a move past the boundary, a stop sweep, and a return. Spring (shakeout) - the same move within the boundaries of accumulation: a fast dip below, stops get wiped out, and there's an instant return into the range. Re-accumulation - a repeat build-up inside an already active trend, usually during a pause after an impulse move. Step-by-step building - adding to the position on every pullback, without trying to catch one single entry point.
How is accumulation different from absorption?
Accumulation is building a position sideways over many candles, while absorption is a specific large volume print that price doesn't react to.
What does an iceberg order look like in the book?
A small order that, after getting filled, reappears at the same level again and again.
Are re-accumulation and accumulation the same thing?
The mechanics are similar, but re-accumulation happens inside an already existing trend and is usually shorter in duration.
False breakout and spring: why the boundary gets pierced
Stops sit beyond the range boundary: below support - buyers' stops, above resistance - sellers' stops. That's ready-made liquidity, and it's the cheapest way to build a position against it. That's where the dip comes from, which then gets bought right back up.
For me, the key thing here is the speed of the return. If price moved past the level and closed there, that's no longer a spring - it's a regular breakout. If it poked through with a wick and returned within the same candle, on elevated volume - that looks like a stop hunt, not a change in direction.
How is a spring different from a regular false breakout?
A spring is a specific type of false breakout that happens right at the boundary of accumulation and returns into the range almost immediately.
How long should I wait for the return after a dip?
I watch the close of the candle on the timeframe where I found the range boundary: closed inside - it's a dip, closed outside - it's a breakout.
The price, volume, and open interest combo
Volume alone doesn't say much: it rises the same way whether a position is being built or closed. Open interest is what separates these two cases. If volume is high and open interest is rising, new positions are entering the market. If volume is high but open interest is falling, someone was exiting rather than entering.
| What I see | How I read it |
|---|---|
| Price up, volume and OI rising | New longs being built |
| Price up, volume present, OI falling | Short covering, not buying |
| Price flat, volume high, OI rising | Looks like accumulation or absorption |
The third element of the combo is the level. The same volume numbers mean different things out in open space versus at a range boundary. That's why I look at everything together: price plus volume plus open interest plus a key level. Taken separately, each one is too easy to interpret however you like.
Frequently asked questions
What does open interest show?
The number of open contracts: a rise means new positions are flowing in, a drop means existing positions are being closed.
Why can't I rely on volume alone?
Volume doesn't distinguish between entering and exiting a position - open interest is needed for that.
Where can I find this data for futures?
The exchange publishes volume and open interest at the end of each session; on CME it's separate stats for every contract.
Do these patterns work on spot markets?
Iceberg orders, accumulation, and false breakouts are visible there too, but spot markets have no open interest, so the combo ends up incomplete.
Volume is high on a rally, but open interest is falling. What does this most likely mean?